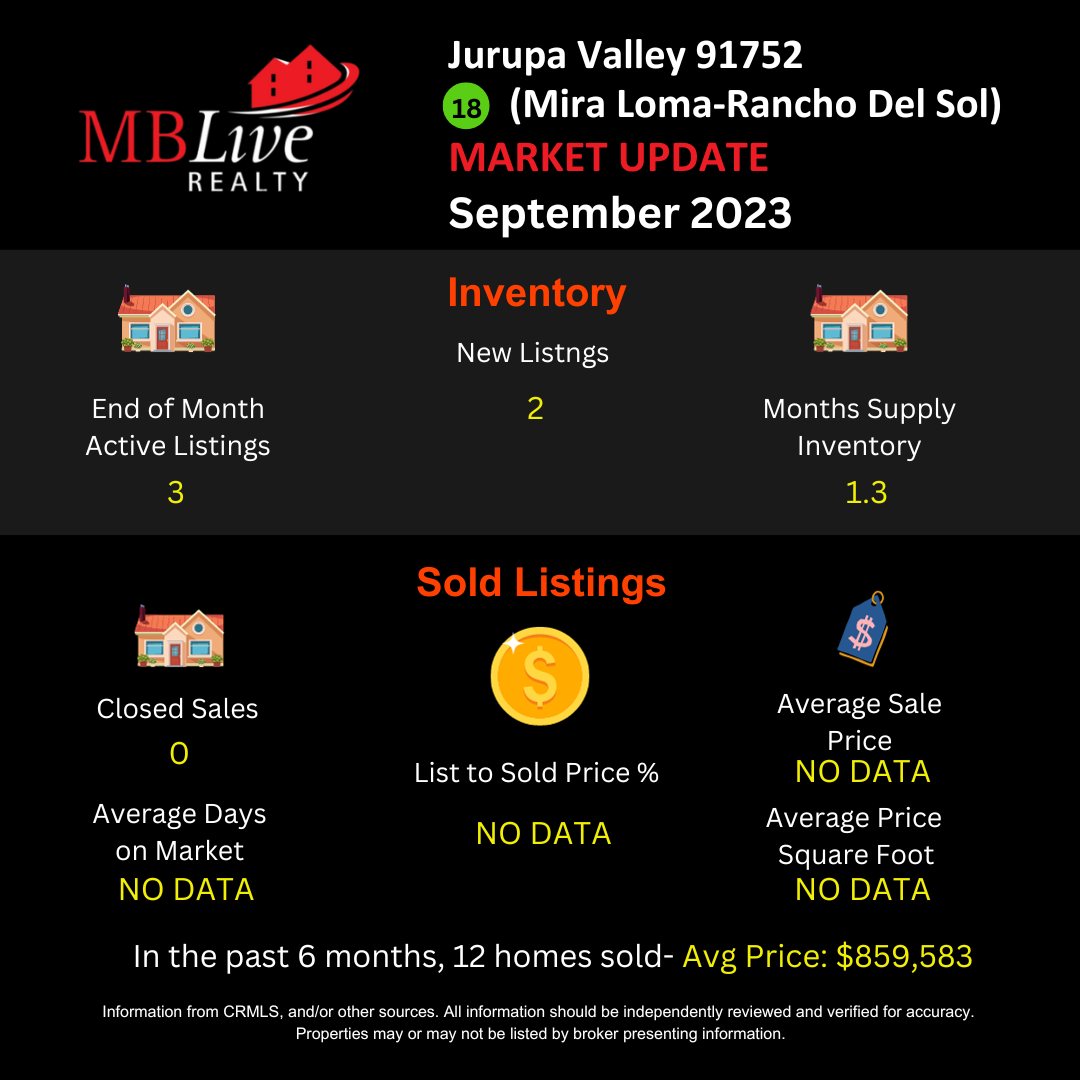
Mira Loma 91752 – August 2023- Real Estate Market Update Report
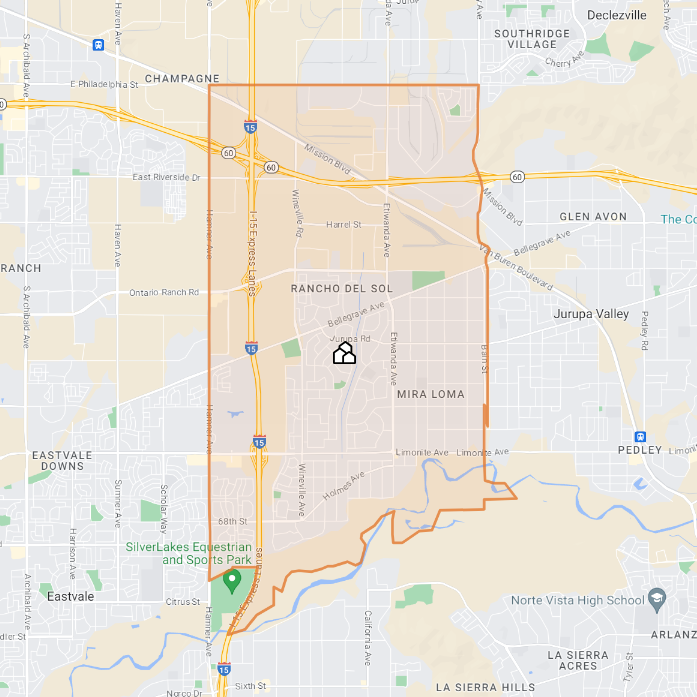
This August 2023 Mira Loma 91752 market update report will dive into the correlation between several key real estate metrics that can greatly impact your selling experience. By analyzing this data, you will gain valuable insights into the current Mira Loma 91752 market conditions and how they may affect your selling process. The report covers the Mira Loma 91752 area which essentially is the north-west area of the city of Jurupa Valley. See the map below.
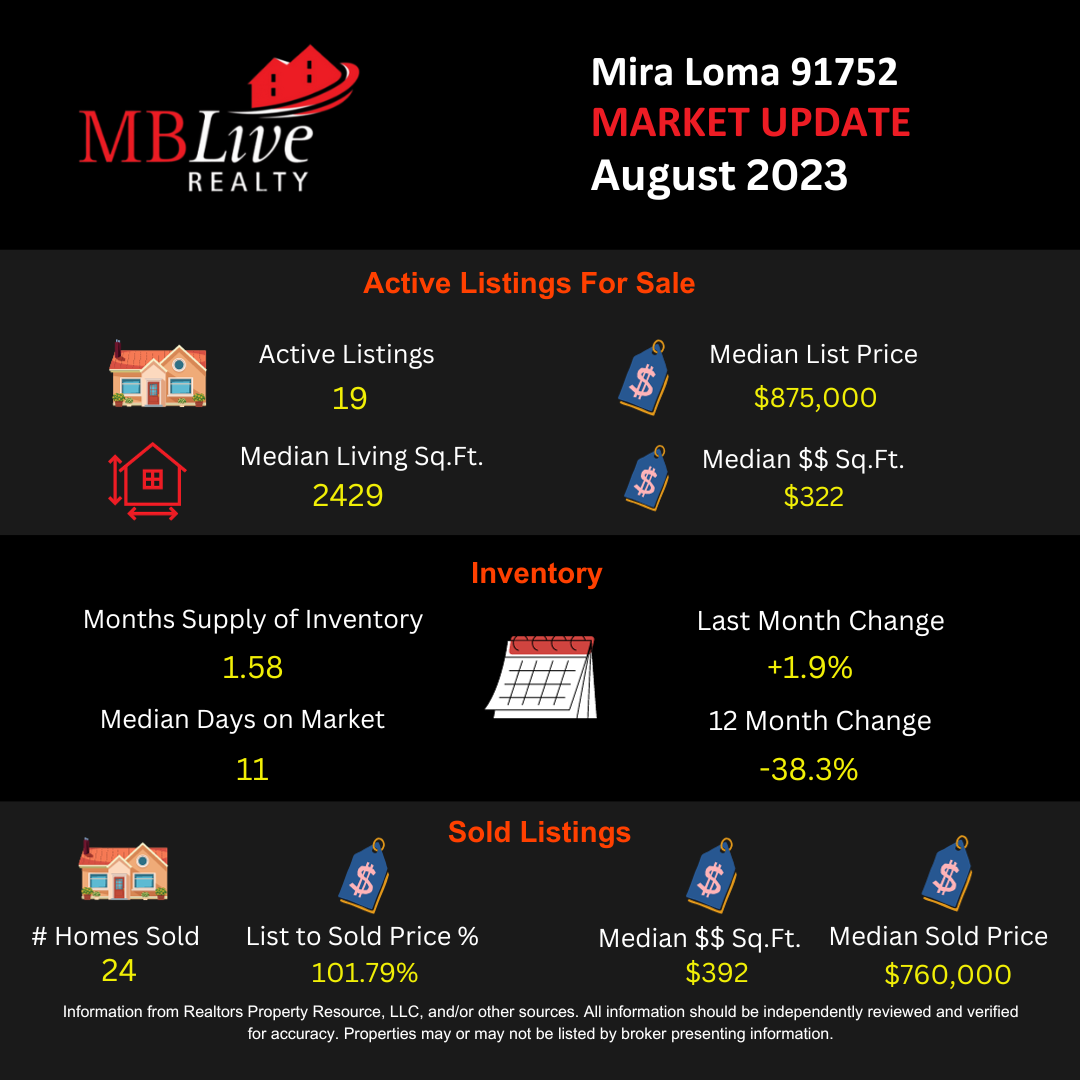
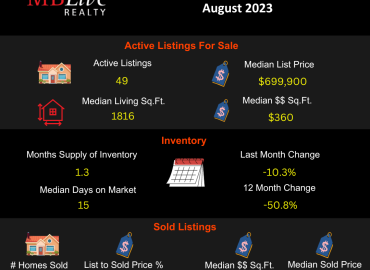
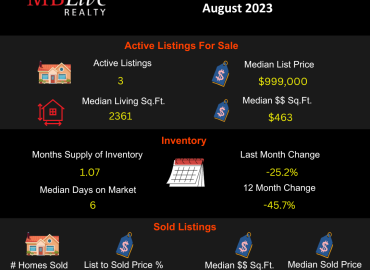
1. Active Listings for Sale:
- Total Active Listings: 19
- Median List Price: $875,000
- Median Living Square Ft.: 2,429 sq. ft.
- Median Dollars per Square Foot: $322
There were 19 active listings in the Mira Loma 91752 area ending August 2023. Of the 19 listings, the median list price was $875,000. Remember, the median is the middle value in a list of numbers. When the numbers are arranged in order, if there’s an odd number of them, the median is the one in the middle. If there’s an even amount, the median is the average of the two middle numbers.
When we analyze the median list price ($875,000) in relation to the median square footage of the listed homes, the approximate value of each is $322 per square foot. This metric gives sellers and potential buyers an idea of the current asking prices within the Mira Loma 91752 area of homes.
2. Inventory:
- Month’s Supply of Inventory: 1.58
- Change from Last Month: +1.9%
- 12 Month Change: -38.3%
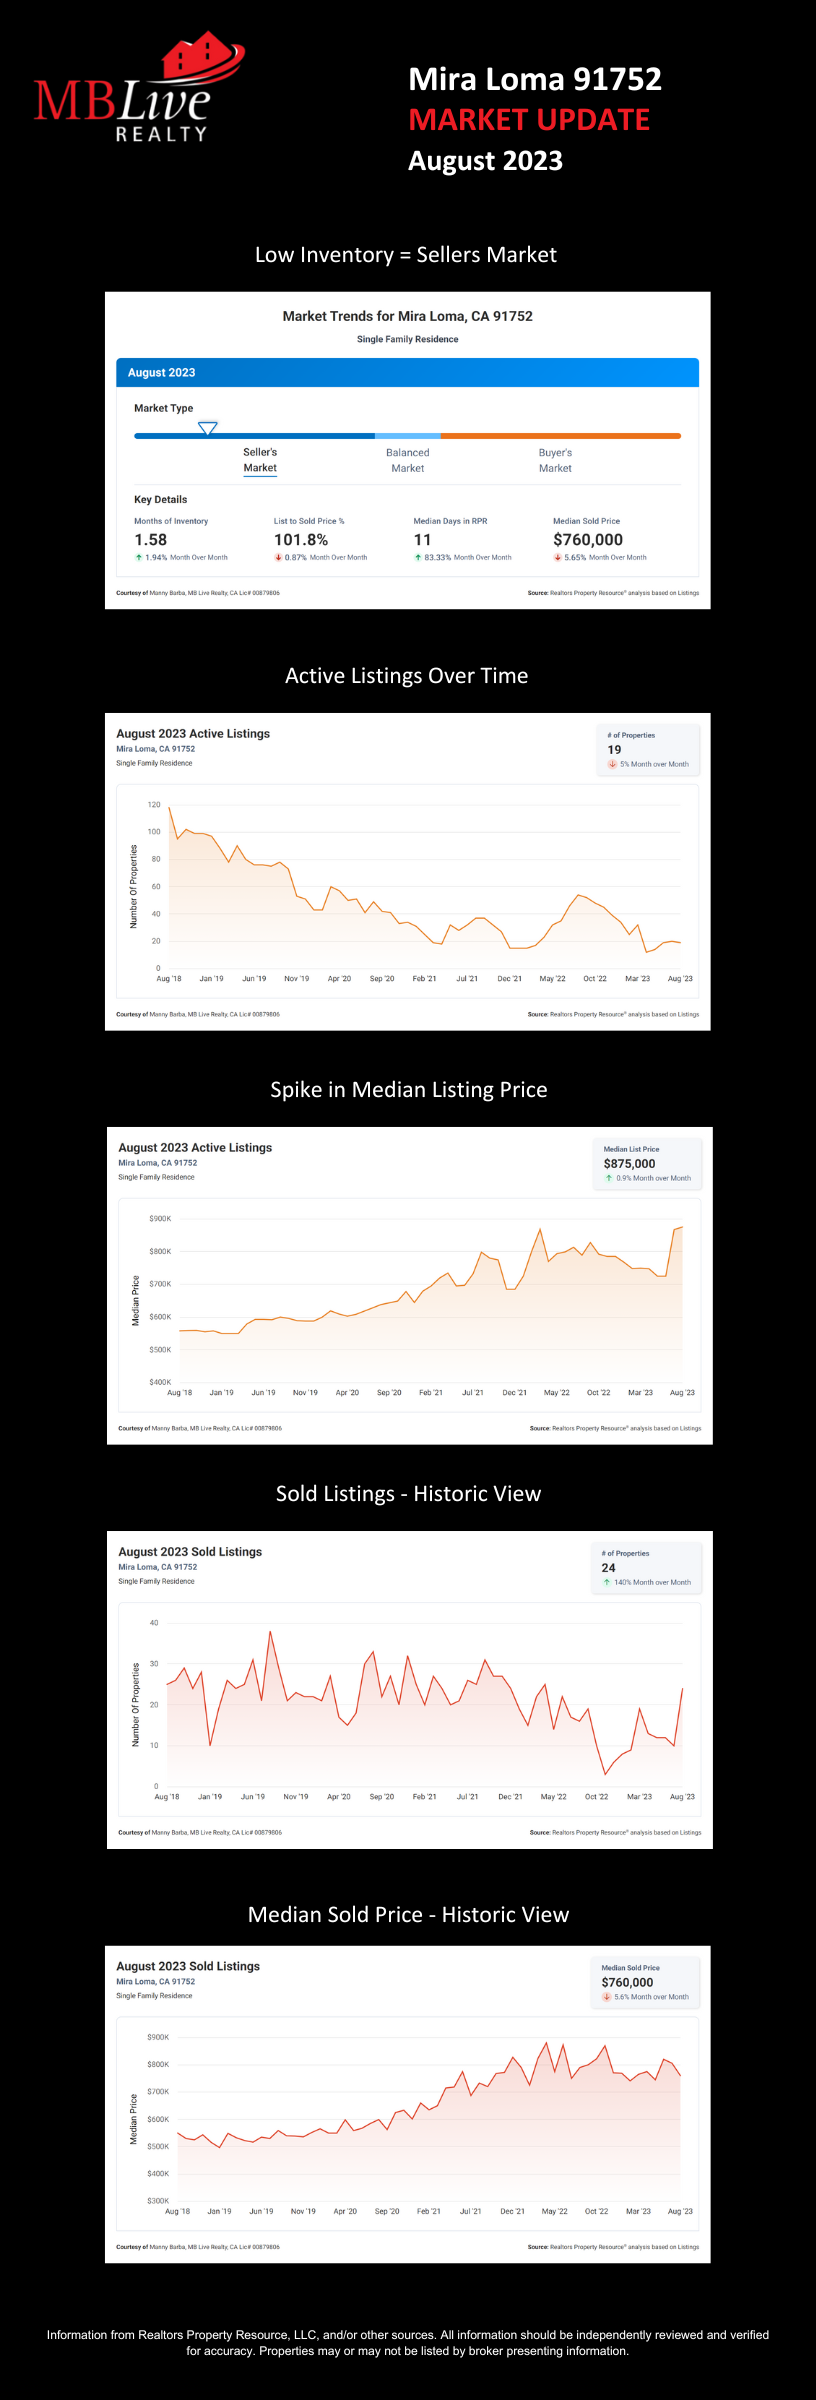
The “Months Supply of Inventory” metric measures the number of months it would take to sell the current inventory of homes on the market, assuming no new listings are added. In our case, the Months Supply of Inventory stands at 1.58. This low number suggests high demand and a seller’s market, which can work in your favor as it indicates that there are fewer homes available for potential buyers to choose from. Clearly the market is currently facing a tight inventory, with just over a month’s supply of homes available for sale.
August’s inventory supply of homes for sale is actually a slight increase from July 2023, up by 1.9%. However, August’s inventory is significantly down 38.3% from the same period last year. This metric helps us understand the trend in the supply of homes over the past year. This decline implies that the market has become even more competitive for sellers, with a greater demand for properties.
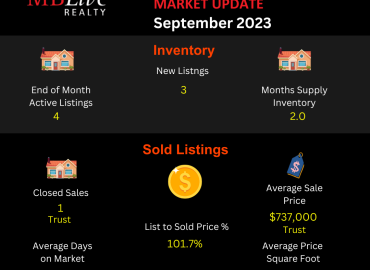
3. Sold Listings:
- No. of Homes Sold: 24
- List to Sold Price %: 101.79%
- Median Days on Market: 11
- Median Sold Price: $760,000
- Median $$ per Square foot: $392
The “number of listings sold” in August 2023 was 24, with the “Median Days on the Market” of 11. This metric reveals the average number of days it takes for a home to sell once it is listed. This incredibly low figure indicates a fast-paced market where properties are being snatched up swiftly. As a seller, this means that your home has a higher chance of being sold quickly, allowing you to move on with your plans.
Next, we examine the “List to Sold Price Percentage.” This metric measures the percentage of the original listing price that a property ultimately sells for. In our case, the List to Sold Price Percentage is an impressive 101.8%. This suggests that, on average, homes are selling for slightly higher than their initial asking price. As a seller, this indicates that you have the potential to maximize your return on investment.
Finally, let’s discuss the “Median Sold Price.” This metric represents the middle point of all homes sold, with half priced above and half priced below. In our analysis, the Median Sold Price is $760,000. This figure gives you an idea of the current market value of properties similar to yours. As a seller, it is essential to consider this median price when setting your own asking price to ensure competitiveness and attract potential buyers. Also as a seller, this means that you have the opportunity to capitalize on the strong demand and potentially secure a favorable selling price.
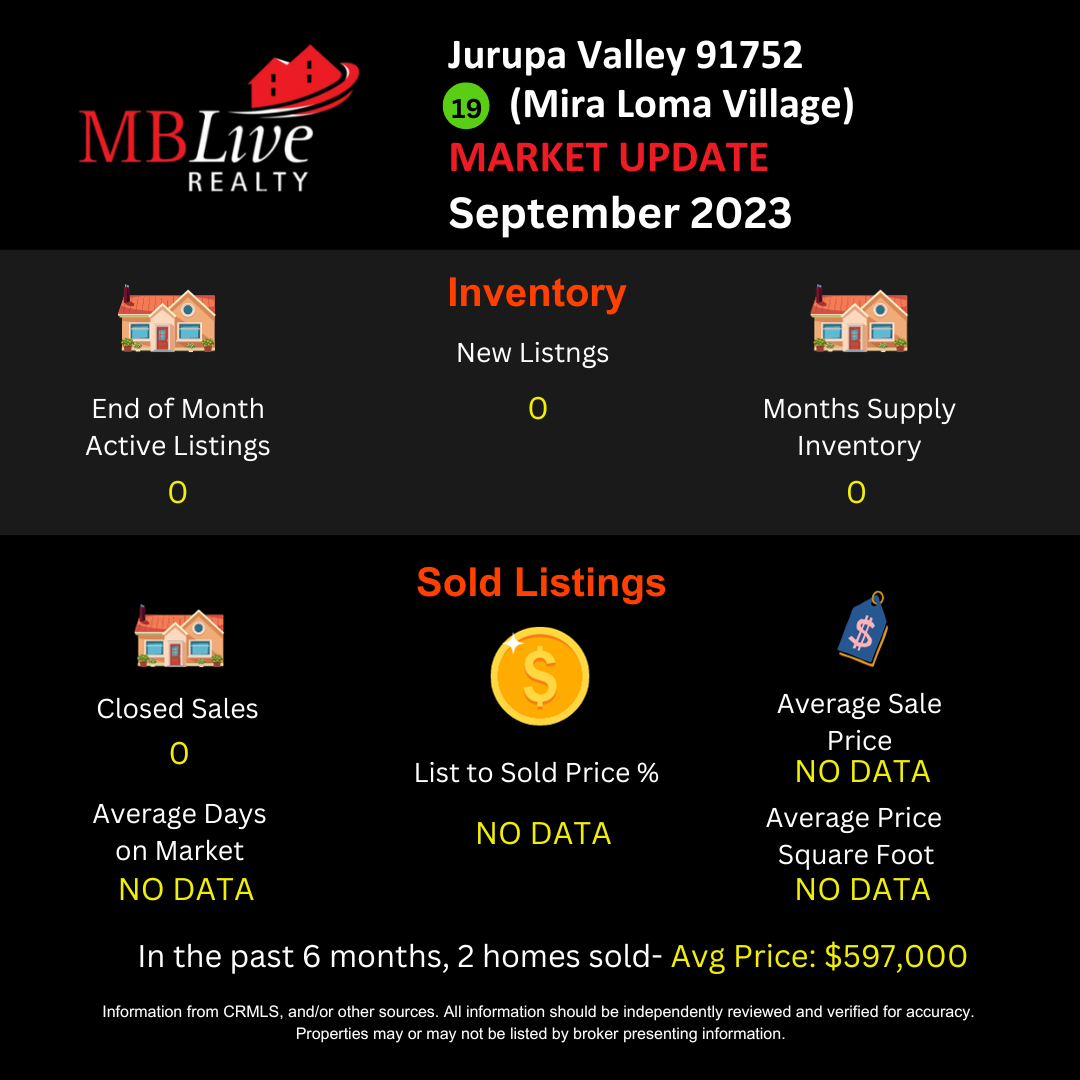
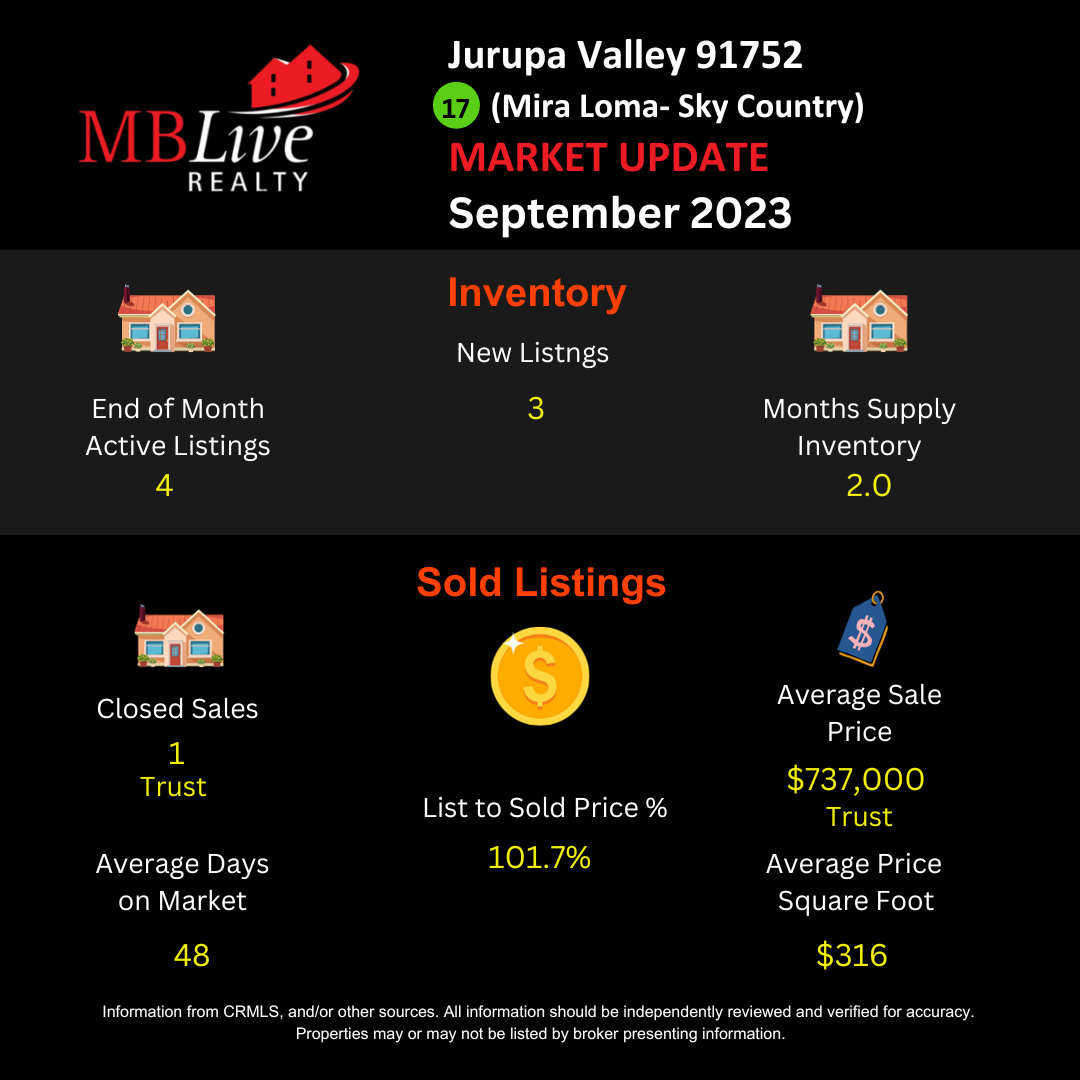
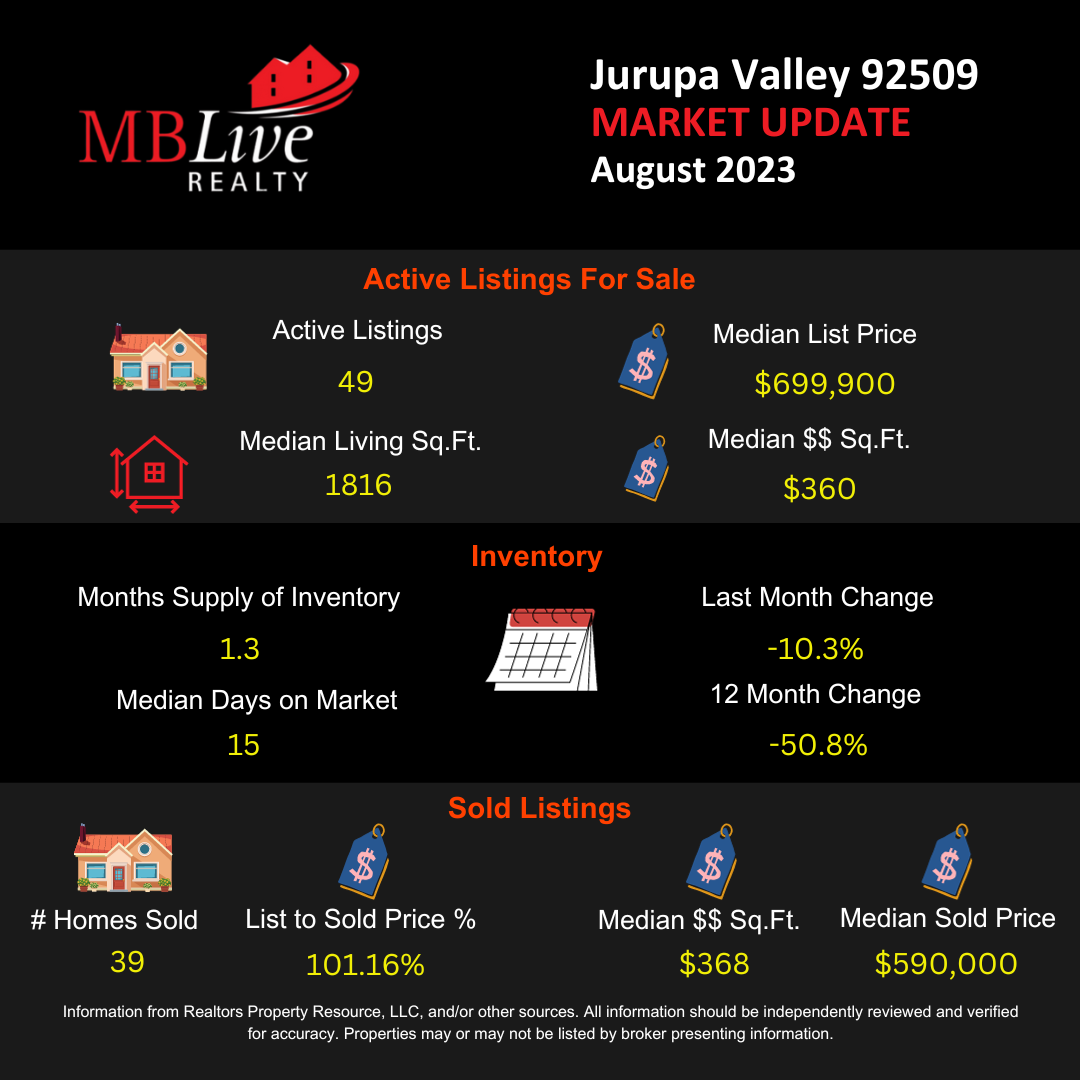
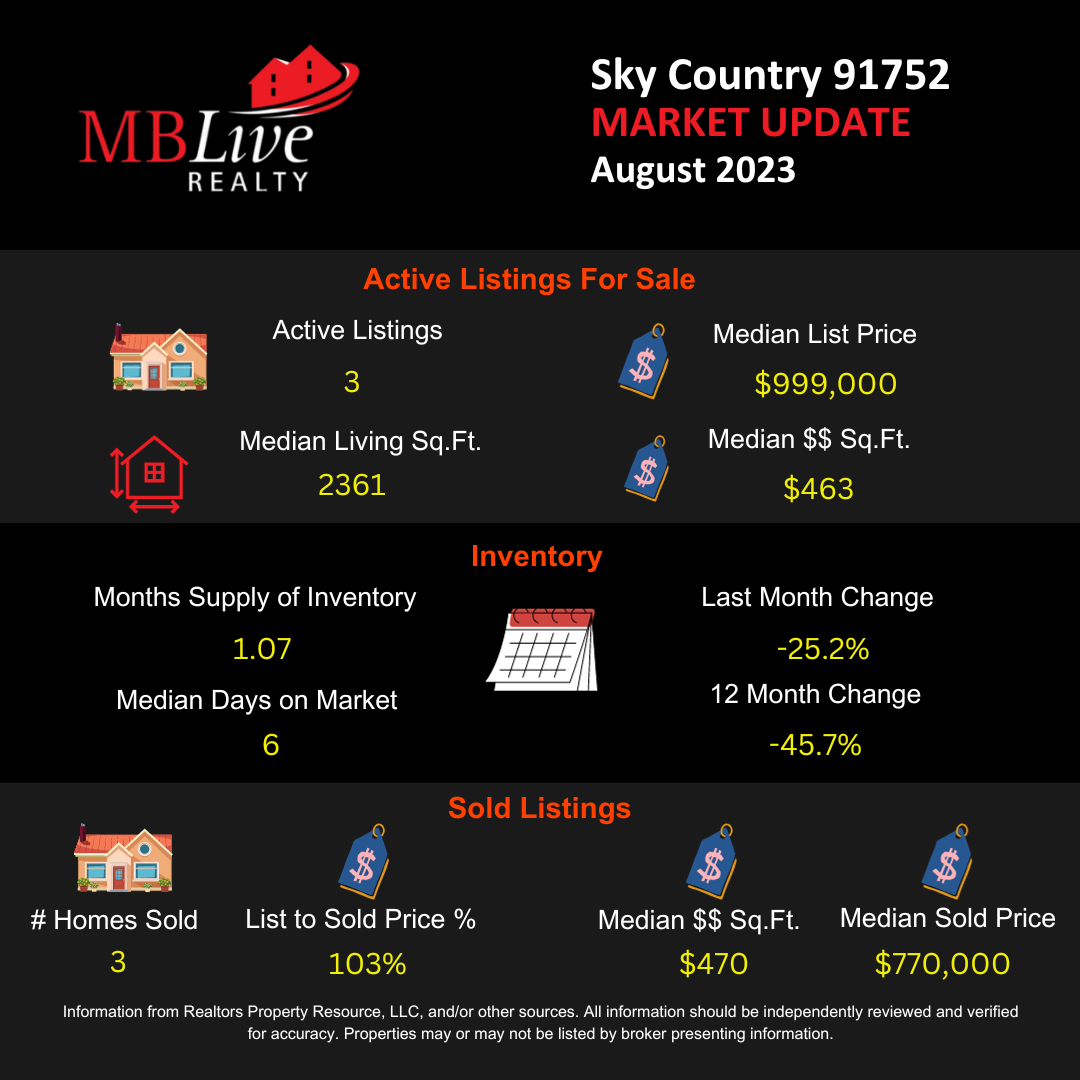
In conclusion, these real estate metrics provide valuable insights into the current market conditions for sellers. With a low Months Supply of Inventory, a significant decrease in the Months of Inventory, a short median time on the market, a high List to Sold Price Percentage, and a median sold price of $760,000, it is evident that the Mira Loma 91752 market is favorable for sellers. This analysis should encourage you to take advantage of the current conditions and confidently pursue your real estate goals. The set of graphics below further expand on the real estate market in Mira Loma 91752 area
I would love to talk with you about what you’ve read here and help you with any questions you might have. You can call or text me today or anytime at 951.990.3998.
Manny Barba
BROKER-ATTORNEY-REALTOR®


No Comments