Jurupa Valley 92509-August 2023-Real Estate Market Update Report
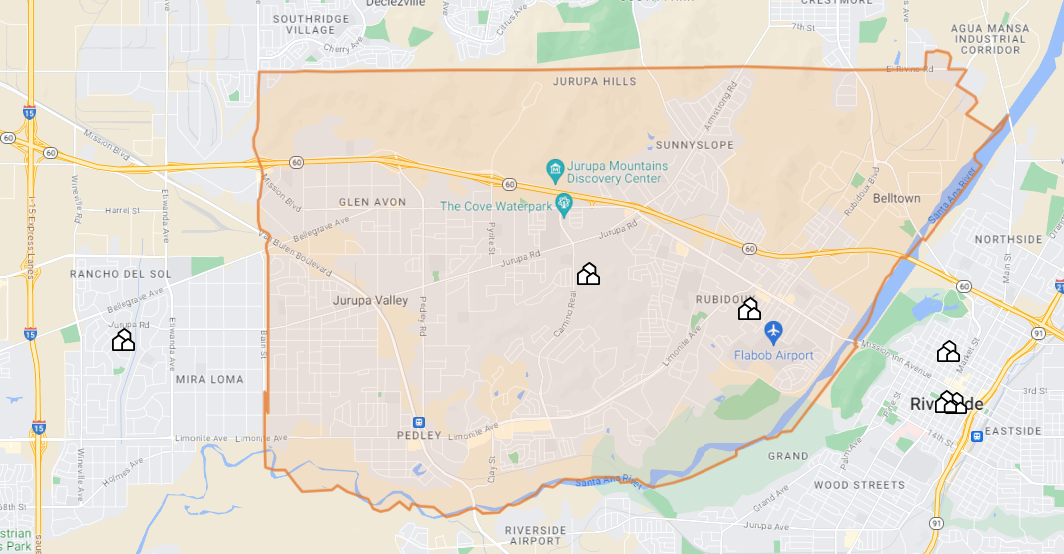
As sellers in the real estate market, it is crucial for you to understand and be aware of the various metrics that impact the selling process. In this report, I will provide you with an insightful analysis of these metrics for the Jurupa Valley 92509 area, allowing you to make informed decisions when selling your property. The area that is the subject of this report focuses on the 92509 (eastern portion) of the city of Jurupa Valley, omitting the 91752 (Mira Loma) area. See the map below.
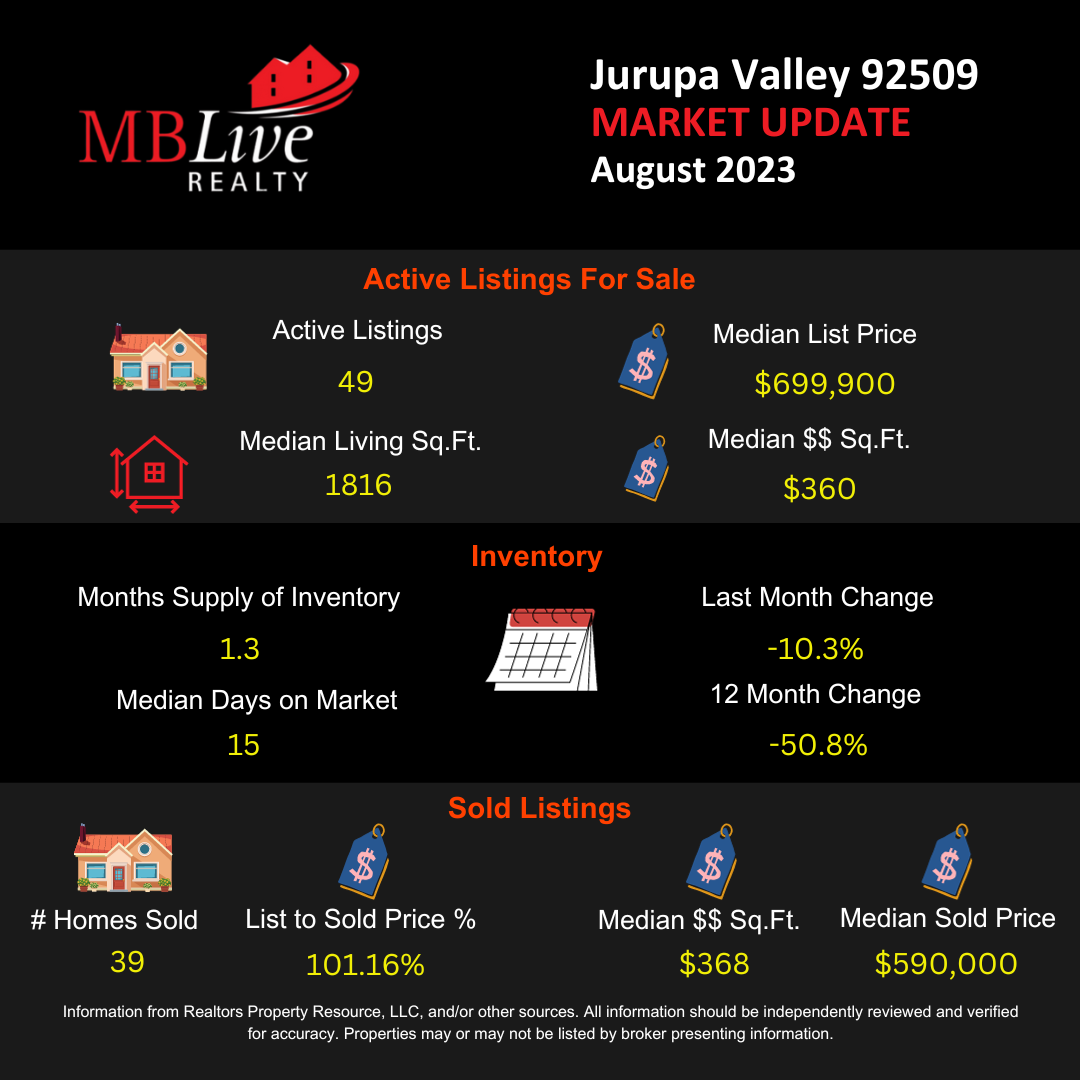
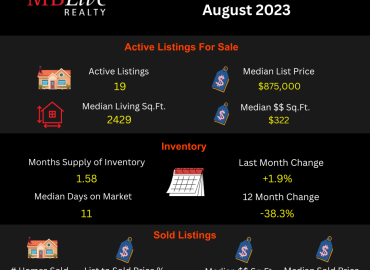
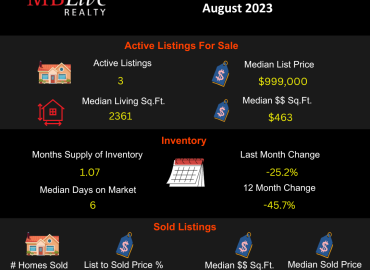
1. Active Listings for Sale:
- Total Active Listings: 49
- Median List Price: $699,900
- Median Living Square Ft.: 1816 sq. ft.
- Median Dollars per Square Foot: $360
There were 49 active listings in the Jurupa Valley 92509 area ending August 2023. Of the 49 listings, the median list price was $699,900.
Remember, the median is the middle value in a list of numbers. When the numbers are arranged in order, if there’s an odd number of them, the median is the one in the middle. If there’s an even amount, the median is the average of the two middle numbers.
When we analyze the median list price ($699,900) in relation to the median square footage of the listed homes, the approximate value of each is $360 per square foot. This metric gives sellers and potential buyers an idea of the current asking prices within the Jurupa Valley 92509 area of homes.
2. Inventory:
- Month’s Supply of Inventory: 1.3
- Change from Last Month: -10.3%
- 12 Month Change: -50.8%
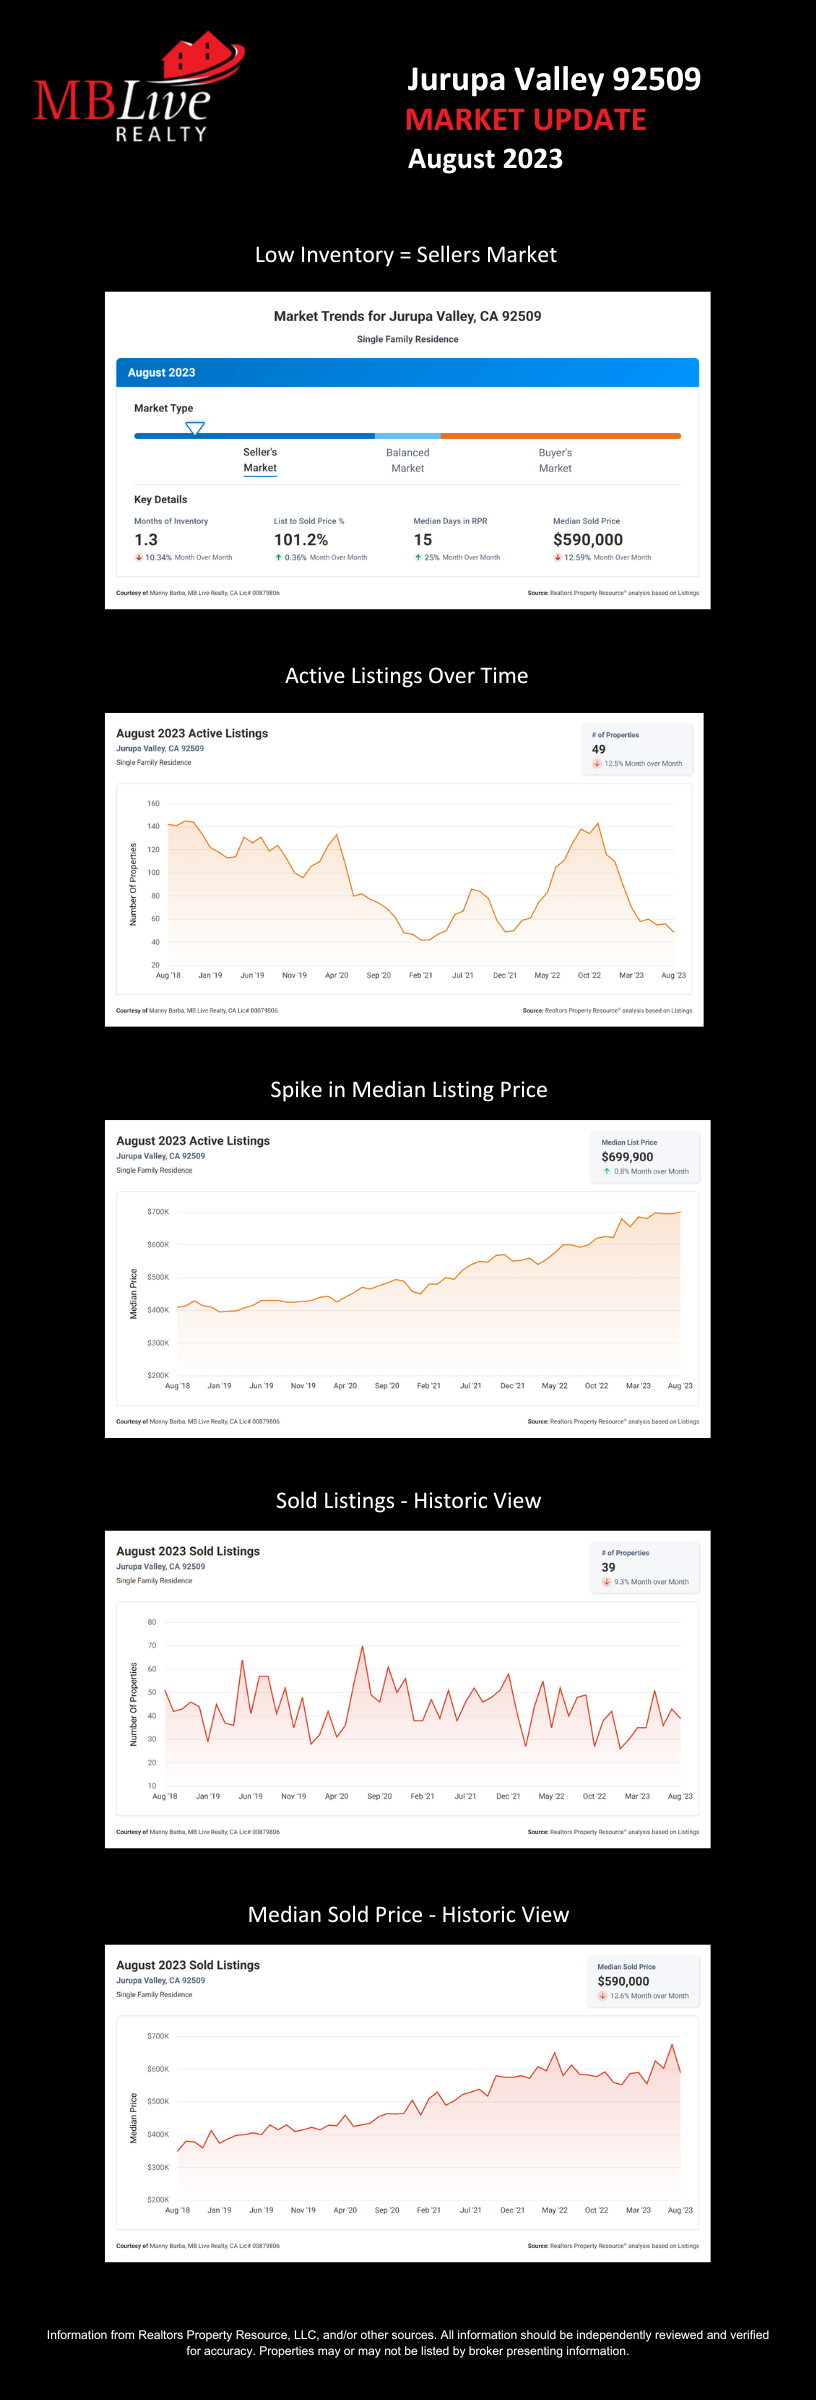
Let’s delve into the ‘months supply of inventory’, which currently stands at 1.3. This metric represents the number of months it would take to sell all the available homes on the market if no new properties were listed. A lower value, such as 1.3, indicates a seller’s market, where demand exceeds supply. This is excellent news for you as sellers, as it suggests a higher likelihood of selling your property quickly. Clearly the market is currently facing a tight inventory, with just over a month’s supply of homes available for sale.
August’s inventory supply of homes for sale has declined from a month ago, July 2023, down by 10.3%. August’s inventory is significantly down from the same period last year, -50.8%. This metric helps us understand the trend in the supply of homes over the past year. This decline implies that the market has become even more competitive for sellers, with a greater demand for properties. Consequently, this can lead to higher selling prices and faster sales for sellers.
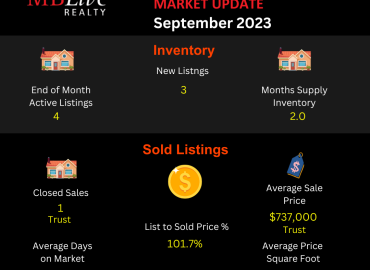
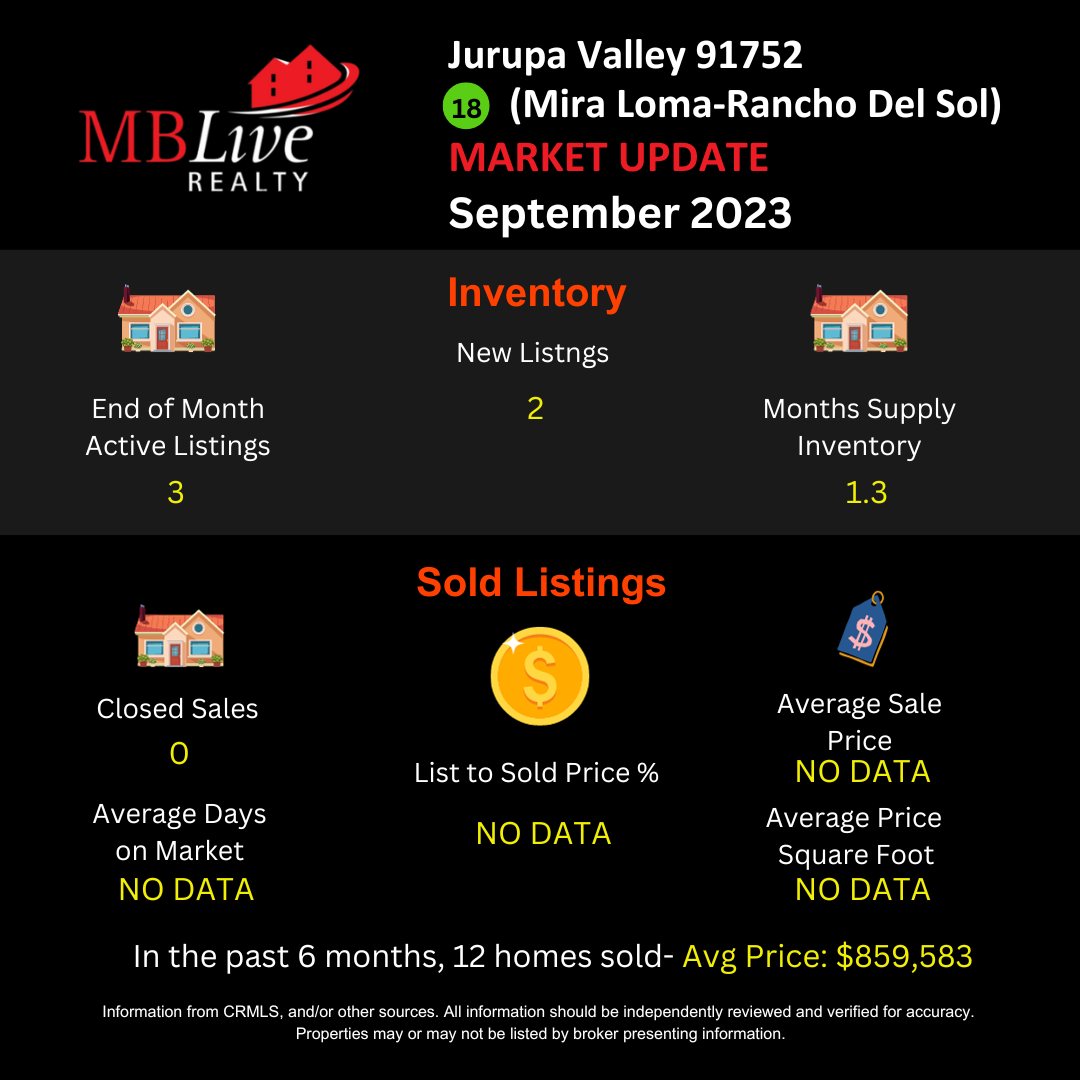
3. Sold Listings:
- No. of Homes Sold: 39
- List to Sold Price %: 101.2%
- Median Days on Market: 15
- Median Sold Price: $590,000
- Median $$ per square foot: $368
The “number of listings sold” in August 2023 was 39, with the “Median Days on the Market” of 15. With a low median of just 15 days, it is evident that properties are moving swiftly in the current market. This should instill confidence in sellers, as it suggests a high demand for homes and an efficient selling process.
Now, let’s turn our attention to the ‘list to sold price percentage,’ which currently stands at an impressive 101.2%. This metric represents the percentage of the listing price at which properties are ultimately sold. A value greater than 100% indicates that homes are selling above their initial listing price. This is unquestionably positive news for sellers, as it implies the potential for higher profits and a competitive market.
Lastly, the median sold price in the current market is $590,000. This metric represents the midpoint of all sold prices, indicating the average price at which properties are being sold. With a median price of $590,000, it is apparent that properties in your market are fetching a substantial value. This is advantageous for sellers, as it suggests the potential for a handsome return on your investment.
Finally, let’s discuss the “Median Sold Price.” This metric represents the middle point of all homes sold, with half priced above and half priced below. In our analysis, the Median Sold Price is $760,000. This figure gives you an idea of the current market value of properties similar to yours. As a seller, it is essential to consider this median price when setting your own asking price to ensure competitiveness and attract potential buyers. Also as a seller, this means that you have the opportunity to capitalize on the strong demand and potentially secure a favorable selling price.
In summary, the correlation between these real estate metrics paints a promising picture for sellers. The months supply of inventory is low, indicating a seller’s market with high demand. The significant decline in the 12-month change in months of inventory suggests a tightening market, leading to increased competition and potentially higher selling prices. The median days homes are on the market is minimal, assuring you of a quick sales process. The list to sold price percentage is above 100%, indicating the potential for selling above the initial listing price. And lastly, the median sold price is substantial, signifying the potential for a lucrative return on your investment.
As sellers in the Jurupa Valley 92509 area, you can utilize this analysis to make informed decisions and take advantage of the current market conditions. By capitalizing on these favorable metrics, you can maximize your selling potential and achieve your desired outcomes. The set of graphics below further expands on the real estate market in the Jurupa Valley 92509 area.
I would love to talk with you about what you’ve read here and help you with any questions you might have. You can call or text me today or anytime on 951.990.3998.
Manny Barba
BROKER-ATTORNEY-REALTOR®


No Comments