Jurupa Valley 91752/92509 Residential Real Estate Market Update Report
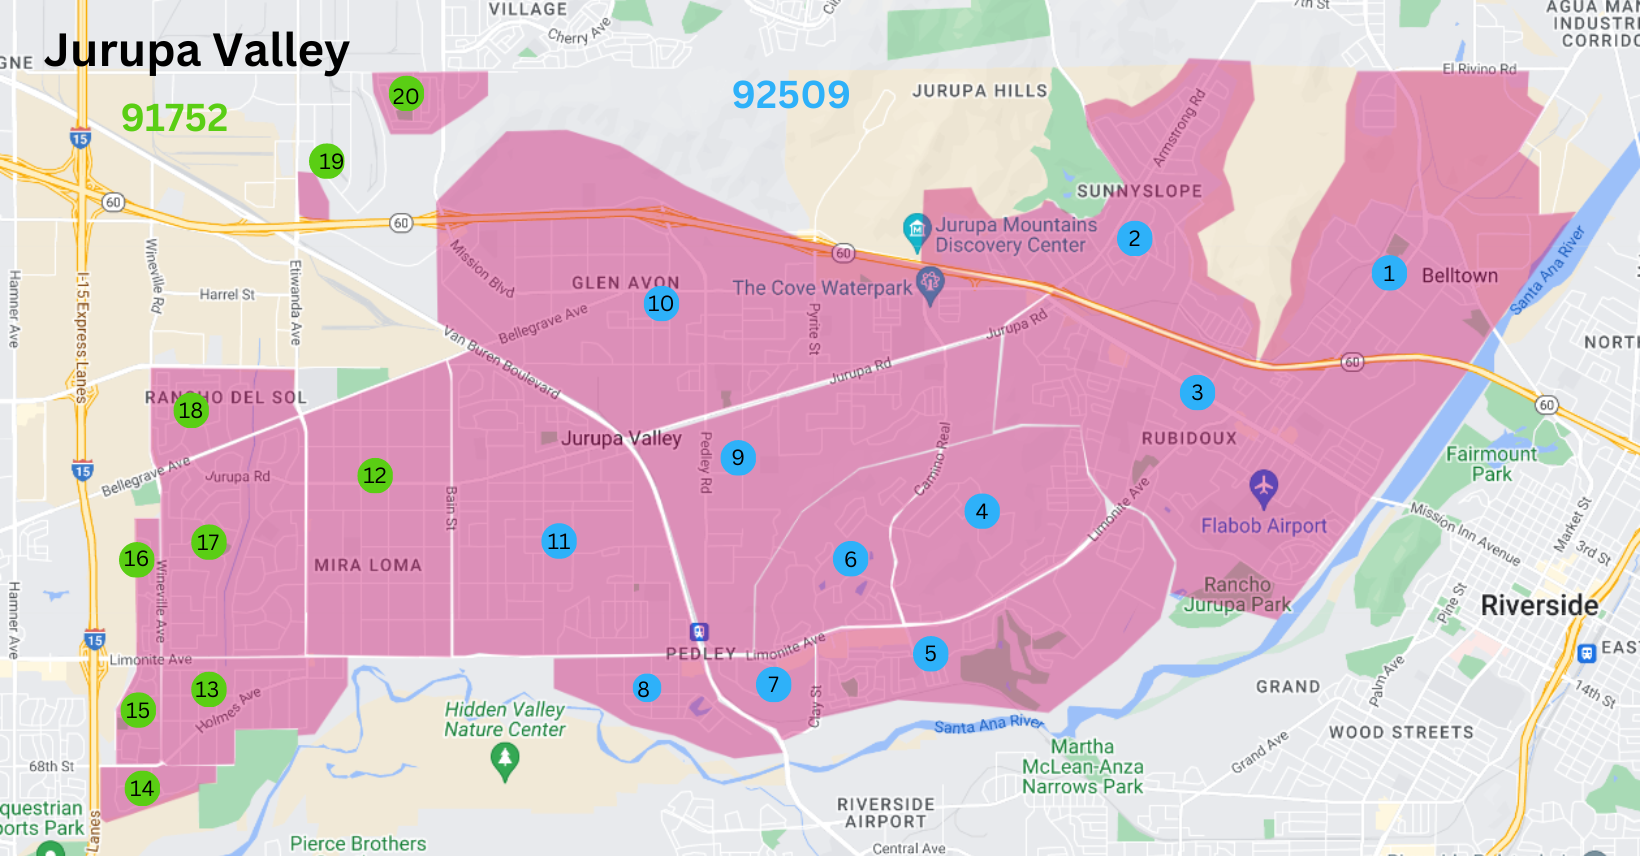
Jurupa Valley 91752/92509
Residential Real Estate Market Update
September 2023
Summary:
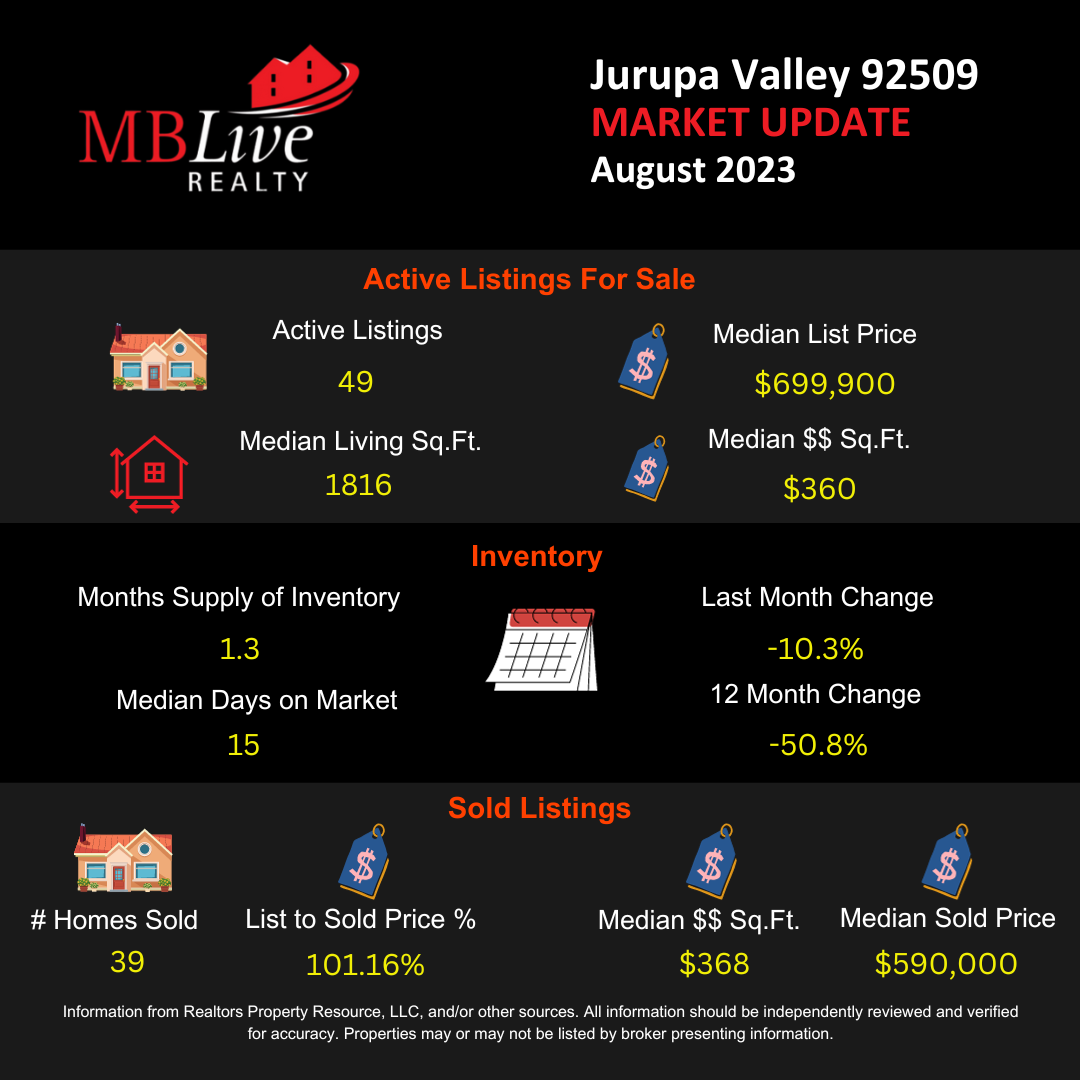
This residential real estate market report for the City of Jurupa Valley for the month ending September 2023 displays
several notable trends and changes when compared to the same period in the previous year. This report aims to provide a concise yet informative summary of key metrics that will assist you in understanding the current market conditions.
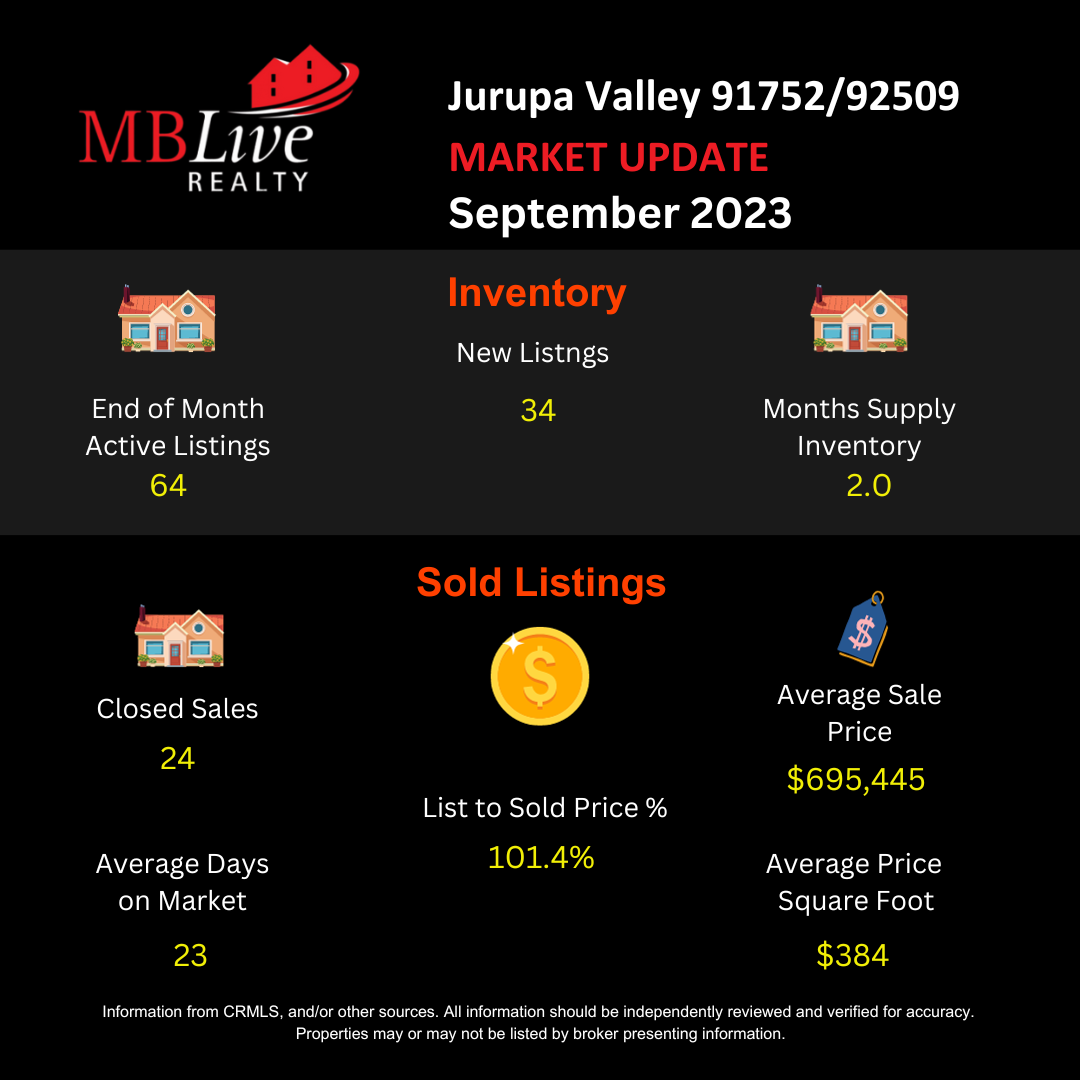
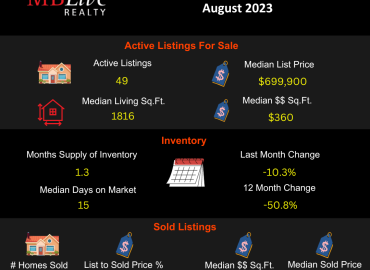
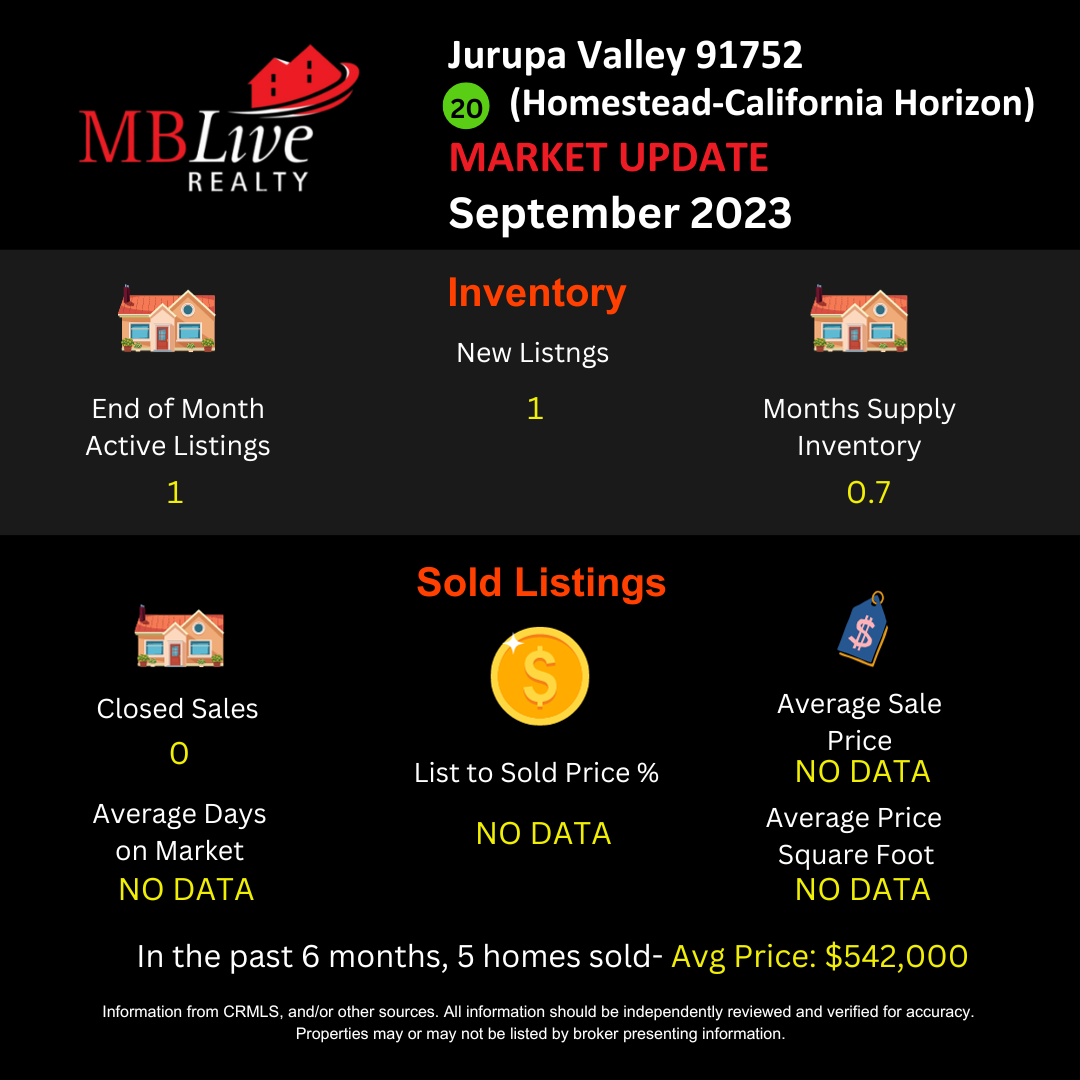
End of Month Active Listings:
At the closing of September 2023, there were 64 active listings in Jurupa Valley, representing a significant decrease of 52.9% from the previous year. This substantial reduction in active listings indicates a tightening of the housing market.
New Listings:
A total of 34 new listings were added to the market, marking a 26.1% decrease from the same month last year. This decline in new listings suggests a potential reduction in seller activity.
Months Supply of Inventory (MSI):
The MSI for September 2023 stood at 2.0 months, showing a substantial 42.9% decrease from the previous year. This metric represents the number of months it would take to sell all the available homes on the market, given the current sales pace. A lower number indicates a seller’s market, where demand outweighs supply.
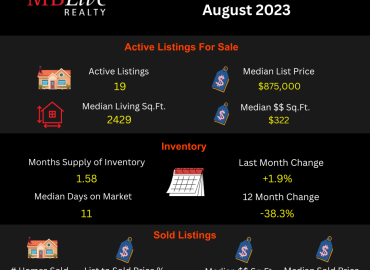
Closed Sales:
There were 24 closed sales in September 2023, reflecting a notable 46.7% decrease from the previous year. This decrease in closed sales could be attributed to reduced inventory.
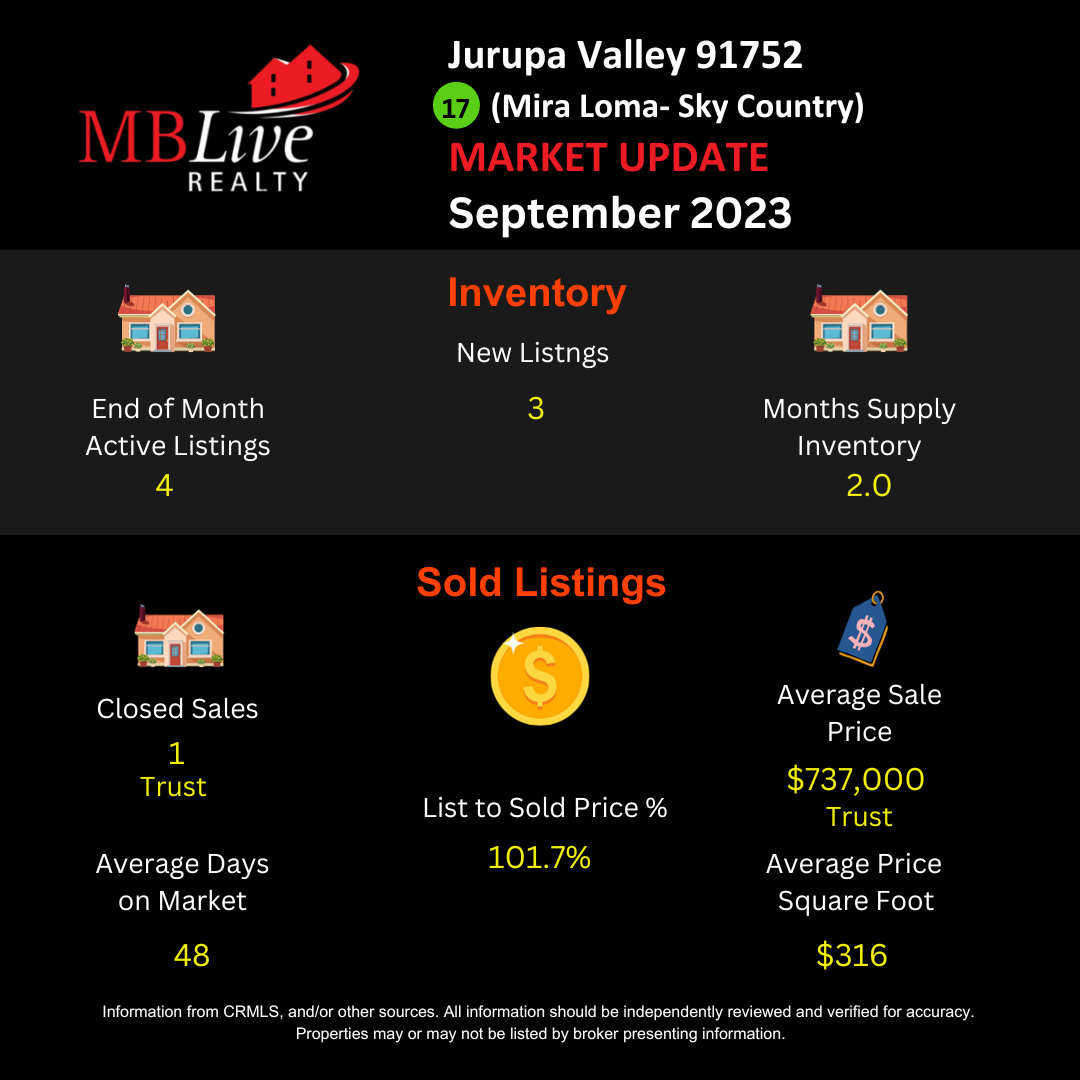
Average Days on Market:
Homes in Jurupa Valley spent an average of 23 days on the market in September 2023, indicating a 17.9% decrease in market time compared to the same period in the previous year. This suggests that properties are selling more quickly.
List to Sold Price %:
The list-to-sold price percentage for September 2023 was 101.4%, showing an increase of 4.8% from the previous year. This suggests that, on average, properties sold for slightly above their listing prices.
Average Sales Price:
The average sales price for homes in Jurupa Valley was $695,445, representing a moderate increase of 1.7% from the previous year. This indicates a stable and gradually appreciating market.
Average Price per Square Foot:
The average price per square foot in September 2023 was $384, reflecting a notable 9.7% increase from the previous year. Thus, property values continue to rise in the City of Jurupa Valley.
Conclusion:
In conclusion, the residential real estate market in Jurupa Valley for the month ending September 2023 presents a dynamic landscape. With a significant reduction in active listings, a lower months supply of inventory, and properties selling faster than in the previous year, it is clear that demand remains robust.
Additionally, the increase in the list-to-sold price percentage and the rise in the average price per square foot indicate that sellers continue to benefit from favorable conditions. However, the decrease in closed sales and new listings could be indicative of some market challenges.
For expert guidance, strategic insights, or a detailed and personalized analysis of your home, or if you have any questions, feel free to contact me. I am committed to providing accurate and updated information to assist you in all your real estate needs.
Manny Barba
Broker-Attorney-Realtor®
951-990-3998
mail@mbliverealty.com
MB Live Realty, Inc.
www.mbliverealty.com
Note: All data in this report is from California Regional Multiple Listing Service (CRMLS) All information should be independently reviewed and verified for accuracy. This report is for informational purposes only and not intended as financial or investment advice.

No Comments