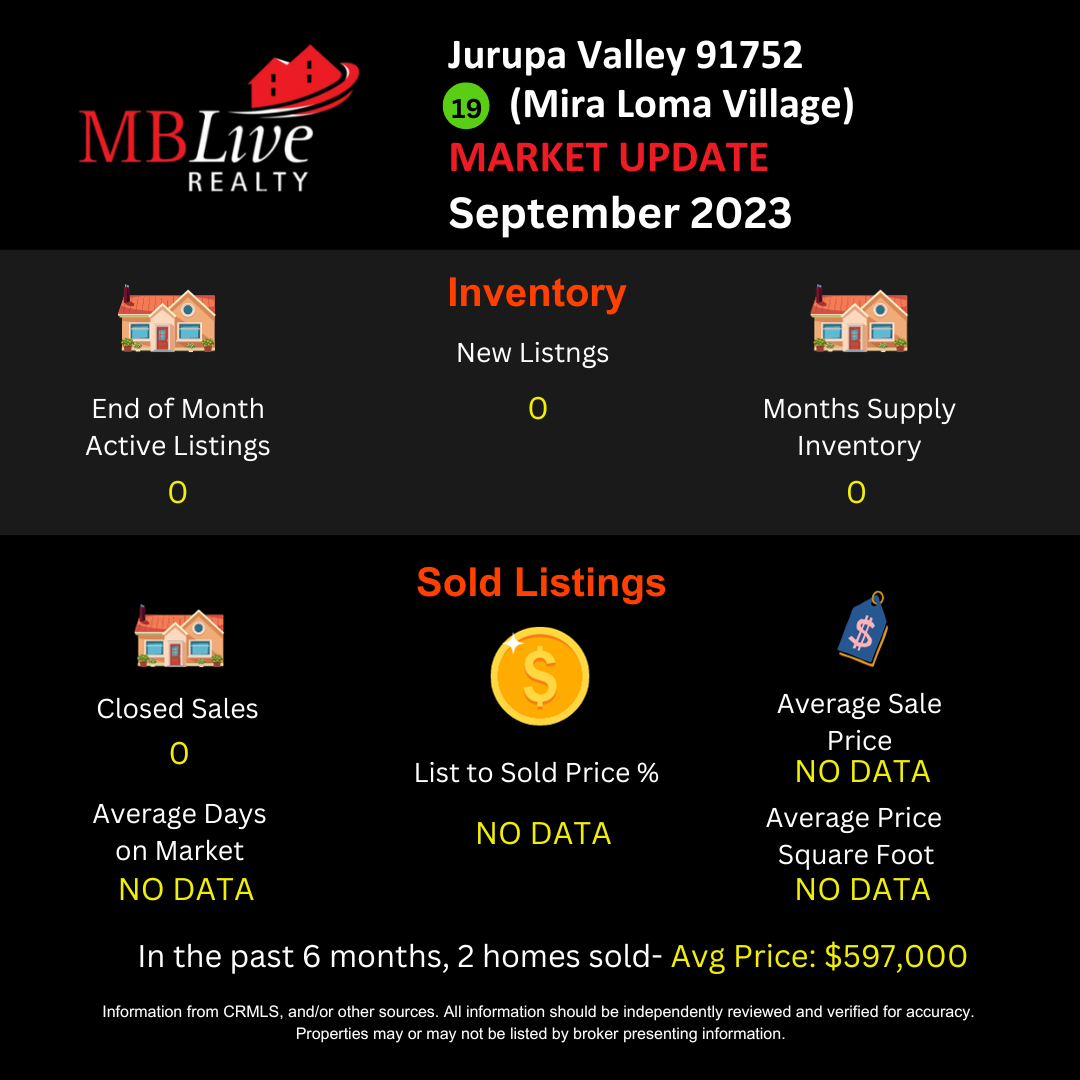
Jurupa Valley 91752/92509 Residential Real Estate Market Update October 2023
Jurupa Valley 91752/92509
Residential Real Estate Market Update
October 2023
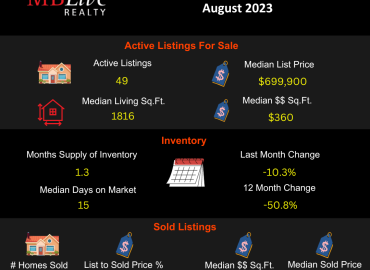
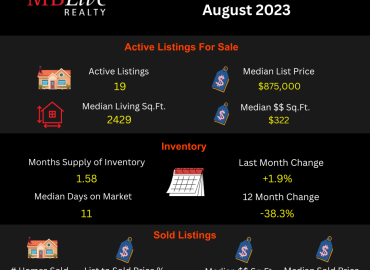
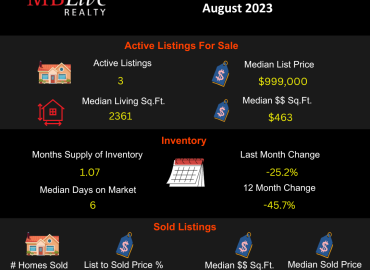
The Jurupa Valley residential real estate market has experienced notable changes as of October 2023. This report provides an overview of key metrics, offering insights into current market trends.
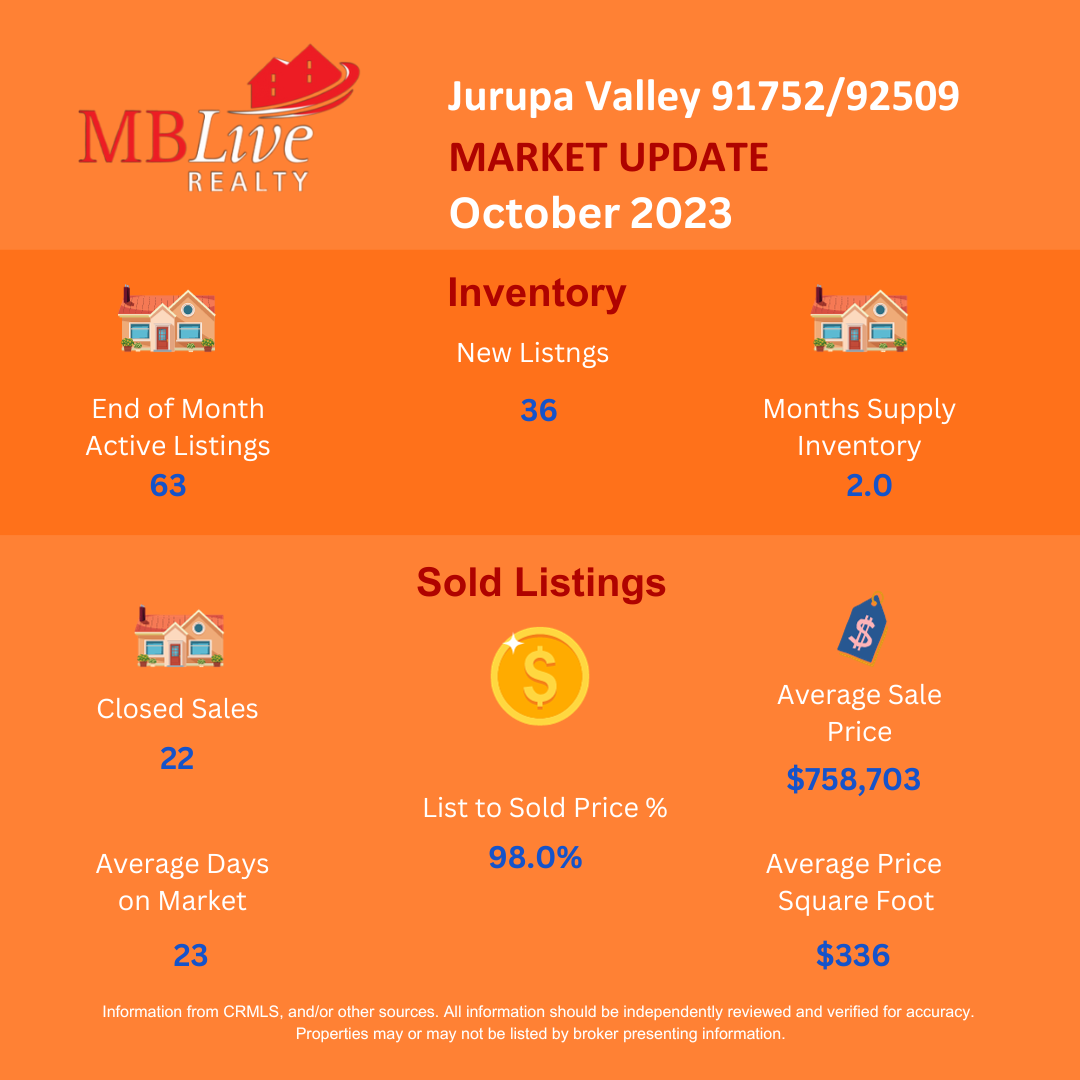
Active Listings:
As the month closed, there were 63 active listings, marking a significant decrease of 51.9% from the same period last year. This reduction indicates a more competitive market with fewer homes available for buyers.
New Listings:
The number of new listings in October was 36, showing a decrease of 26.1% from the previous year. This suggests that fewer homeowners are putting their properties on the market compared to last year.
Months Supply Inventory:
The inventory stood at 2.0 months, down 42.9% from a year ago. A lower months supply typically points towards a seller’s market, where demand is outpacing supply.
Closed Sales:
There were 22 closed sales in October, a decrease of 24.1% compared to last year. This decline in sales activity might indicate a more cautious approach from buyers or a reflection of the limited inventory.
Average Days on Market:
Properties are selling faster, with homes staying on the market for an average of 23 days, down 28.1% from last year. This faster turnover suggests that despite fewer listings, buyer demand remains strong.
List to Sold Price Percentage:
The list to sold price percentage was 98.0%, a slight decrease of 2.18% from the previous year. This indicates that homes are selling close to their asking prices but with a bit more room for negotiation compared to last year.
Average Sales Price:
The average sales price in Jurupa Valley was $758,703, representing a significant increase of 12.7% from last year. This rise in the average sales price highlights the increasing value of properties in the area.
Average Price per Square Foot:
The average price per square foot stood at $336, showing a slight decrease of 4.0% from the previous year. This slight drop could indicate a shift in the types of properties being sold or market adjustments.
Conclusion:
The Jurupa Valley residential real estate market in October 2023 shows a blend of decreased availability and increased property values. The market is leaning towards sellers, with faster sales and relatively high sales prices.
However, the slight drop in the average price per square foot and the decrease in list to sold price ratio suggest a nuanced market where strategic pricing and quick decision-making are key for success.
For a comprehensive understanding of how these trends can impact your real estate decisions, contact me. I provide expert guidance and strategic insights and can guide you through these interesting times in real estate.
For expert guidance, strategic insights, or a detailed and personalized analysis of your home, or if you have any questions, feel free to contact me. I am committed to providing accurate and updated information to assist you in all your real estate needs.
Manny Barba
Broker-Attorney-Realtor®
951-990-3998
MB Live Realty, Inc.
Note: All data in this report is from California Regional Multiple Listing Service (CRMLS) All information should be independently reviewed and verified for accuracy. This report is for informational purposes only and not intended as financial or investment advice.

No Comments