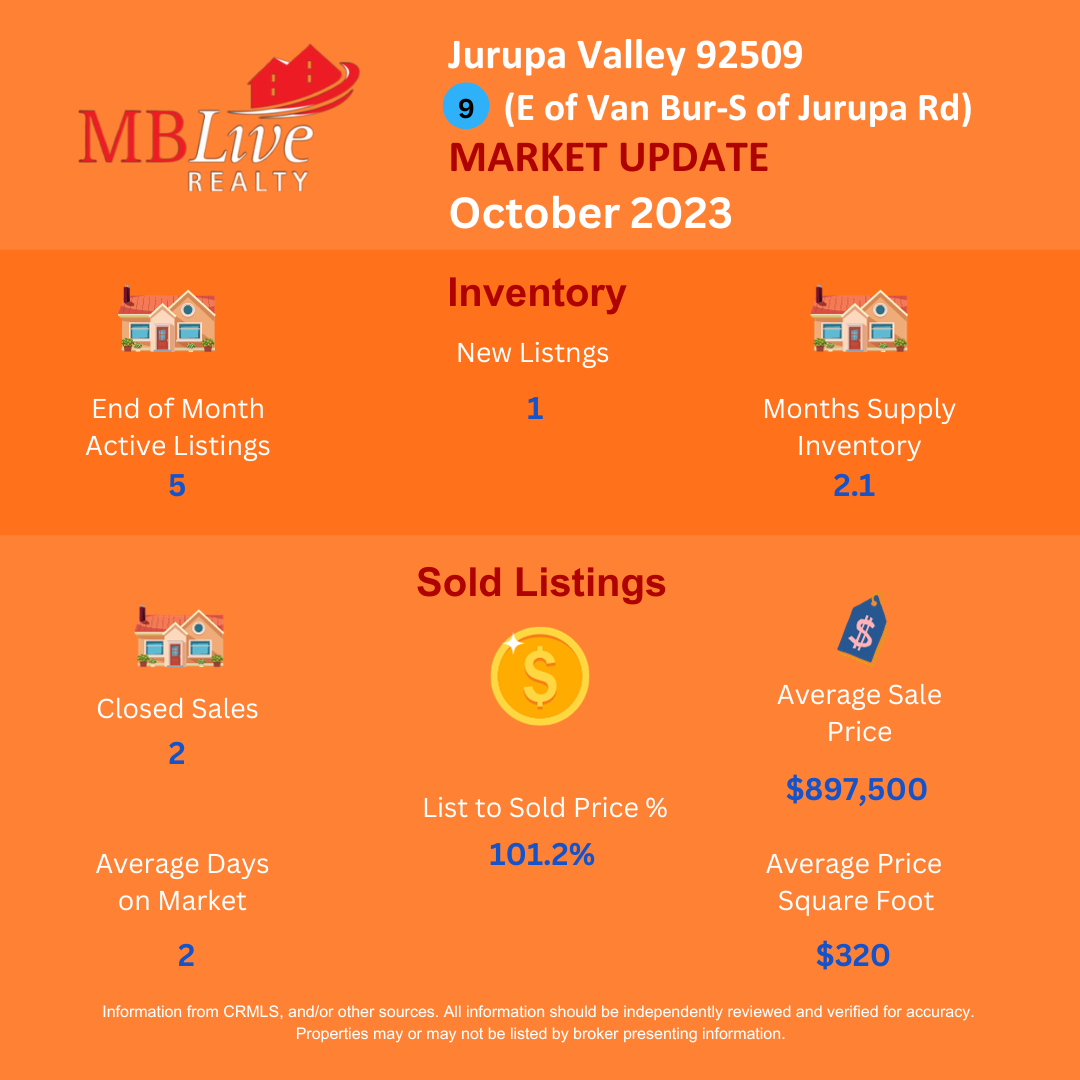
Area 9- East of Van Buren Blvd/South of Jurupa Rd. -Jurupa Valley Residential Real Estate Market Update-October 2023
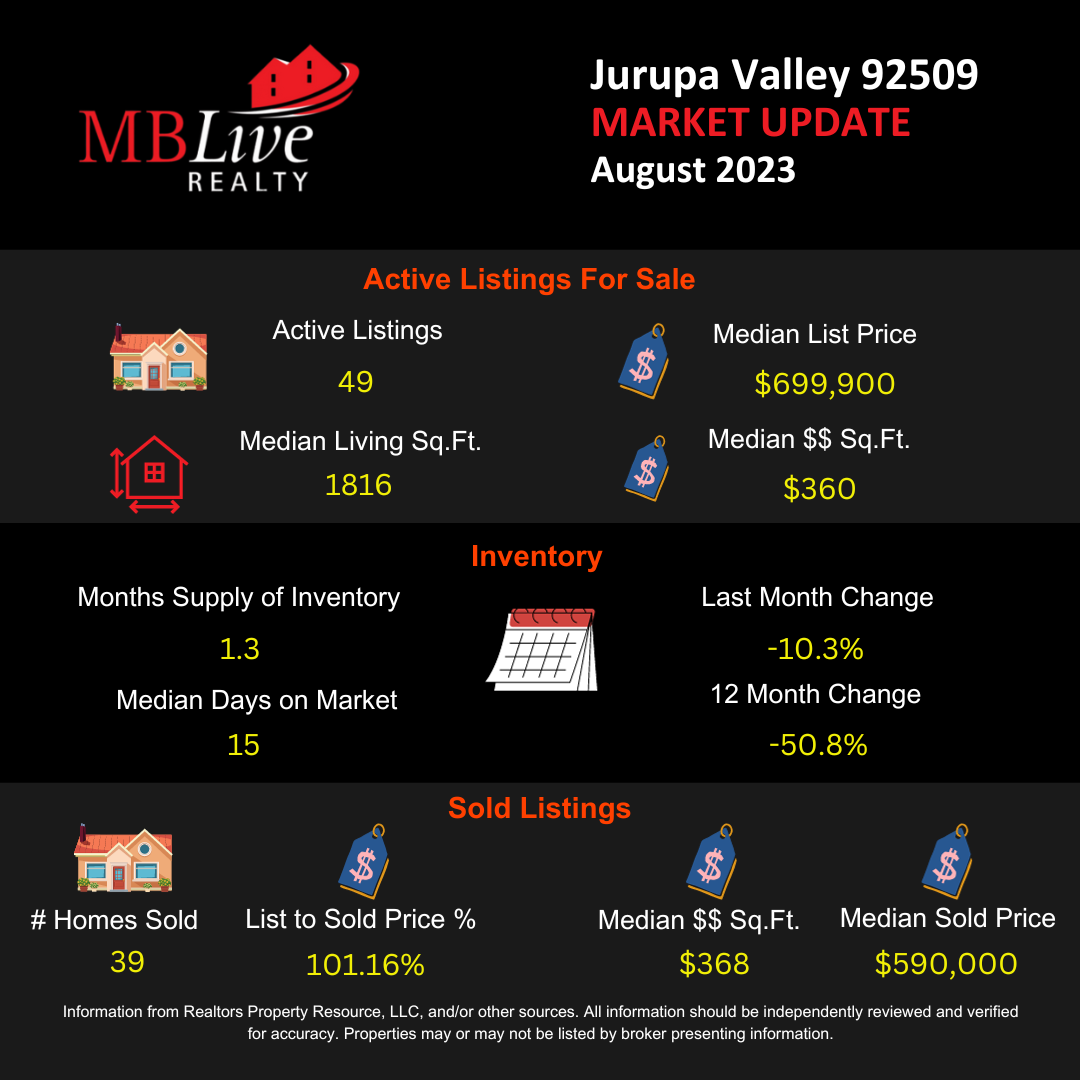
Jurupa Valley 92509
Real Estate Market Update
October 2023
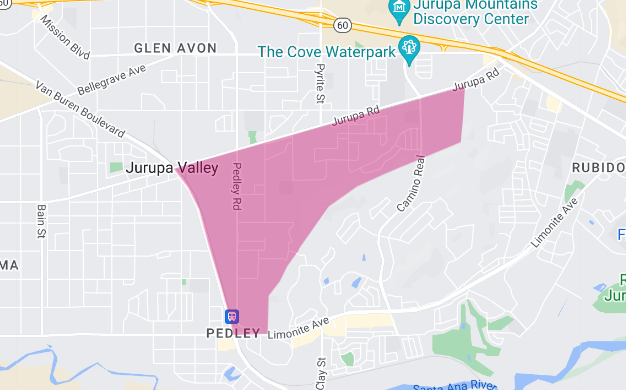
Area of Focus:
9- East of Van Buren Blvd/South of Jurupa Rd. (See Map)
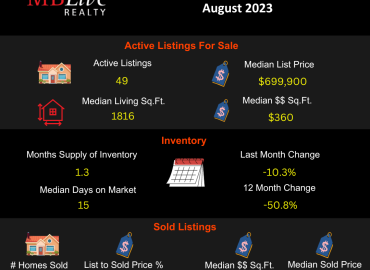
The real estate landscape in October 2023 presented a mix of decreased listings but increased prices, indicating a potentially tighter market.
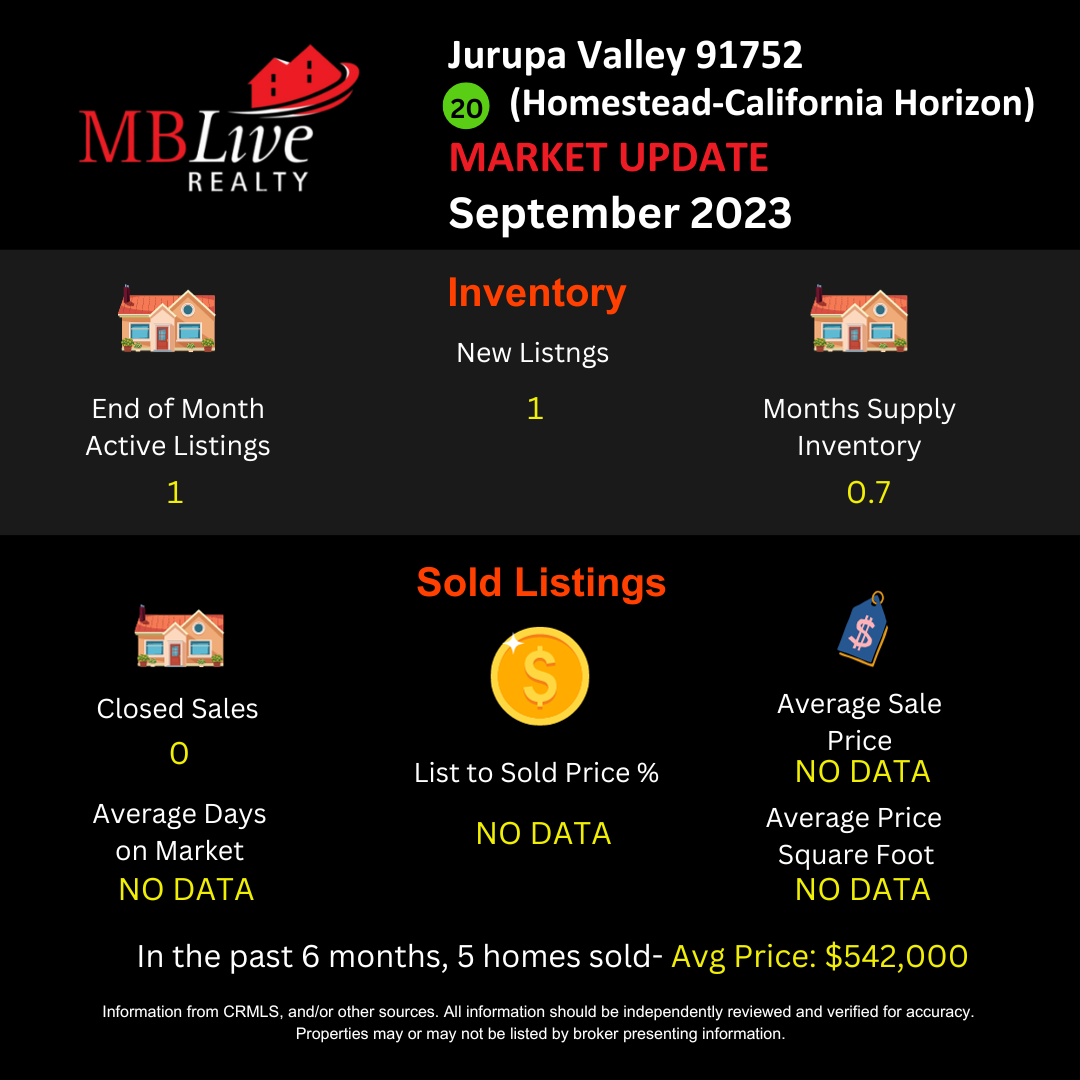
End of Month Active Listings:
There were only 5 active listings, marking a significant decrease of 54.5% compared to the same period last year.
New Listings:
With just 1 new listing, the market saw a reduction by 50% from the previous year.
Months Supply Inventory:
The inventory stood at 2.1 months, a notable decrease of 44.7% from last year, suggesting a quicker turnover in the property market.
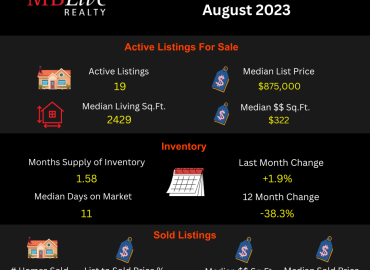
Closed Sales:
Mirroring last year’s data, there were 2 closed sales.
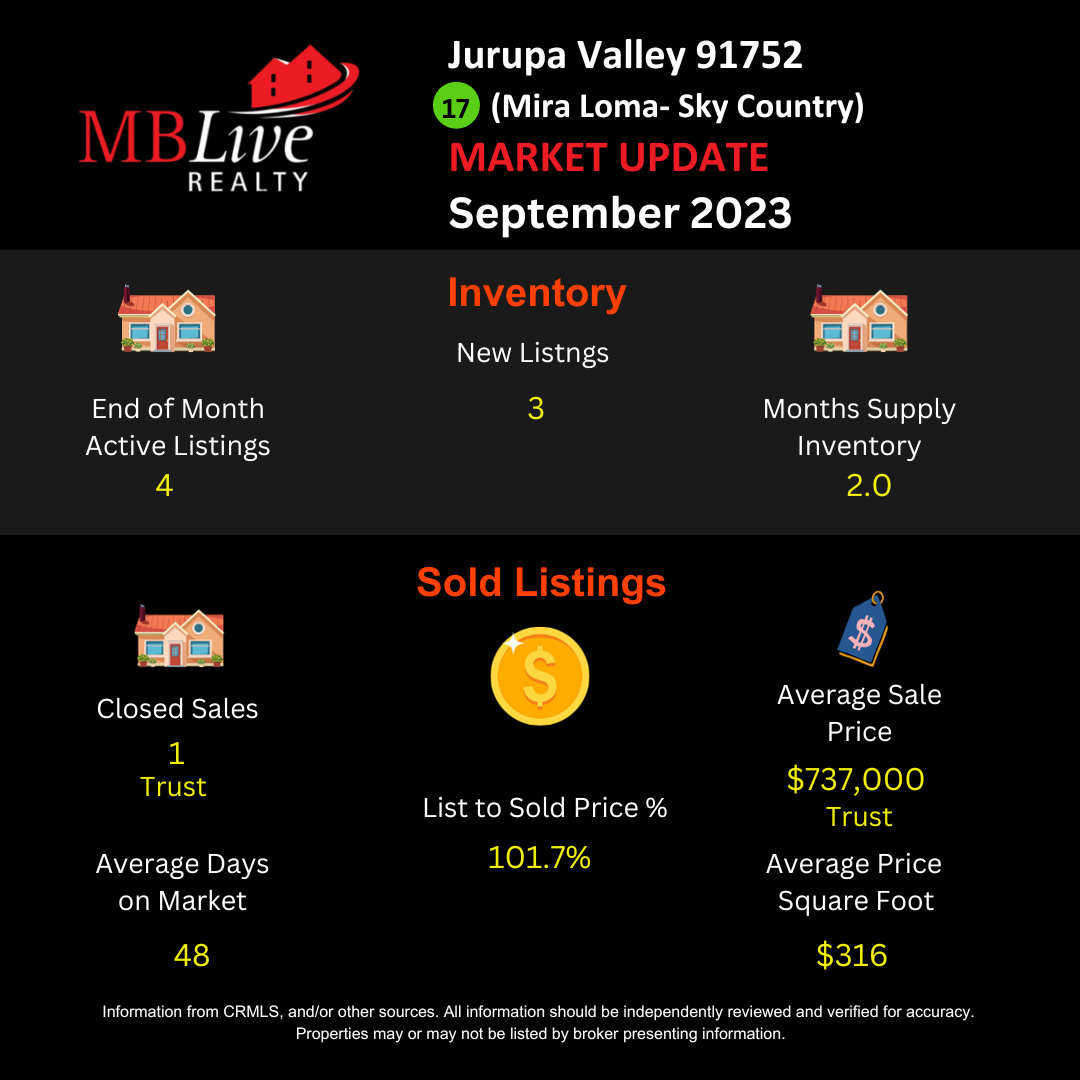
Average Days on Market:
Homes sold remarkably quickly, with an average of just 2 days on the market, plummeting by 88.9% from the previous year.
List to Sold Price %:
Properties sold for 101.2% of their list price, showing an increase of 8.6% from last year.
Average Sales Price:
The average sales price soared to $897,500, a significant increase of 57.5% from last year.
Average Price per Square Foot:
The average price per square foot was $320, reflecting a decline of 22.5% from the previous year.
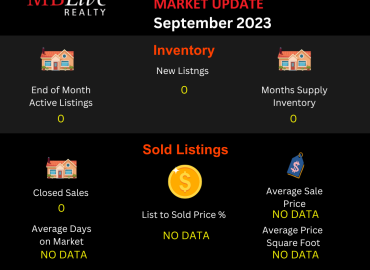
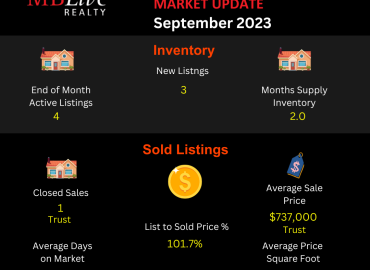
Comparative Analysis: October vs. September 2023
When comparing October to September 2023, several trends become evident:
Active Listings: October saw a slight increase in active listings compared to September.
New Listings: There was a significant drop in new listings from September to October.
Months Supply Inventory: The market tightened in October, with a lower inventory compared to September.
Closed Sales: October experienced a slight uptick in closed sales.
Average Days on Market: Properties in October sold faster than in September.
List to Sold Price %: There was a minor decrease in the list to sold price percentage from September to October.
Average Sales Price: A notable increase in average sales price was observed in October.
Average Price per Square Foot: The price per square foot in October was slightly less compared to September.
Conclusion:
The residential real estate market in this area of Jurupa Valley for October 2023 displayed a unique combination of decreased inventory and increased average sales prices, indicating a seller’s market.
The market dynamics show that while there are fewer properties available, those on the market are selling quickly and often above the list price. This trend highlights a robust demand in the area, which is an essential factor for both sellers and buyers to consider in their real estate strategies.
For a comprehensive understanding of how these trends can impact your real estate decisions, contact me. I provide expert guidance and strategic insights and can guide you through these interesting times in real estate.
And for a detailed and personalized analysis of your home, or if you have any questions, feel free to contact me. I am committed to providing accurate and updated information to assist you in all your real estate needs.
Manny Barba
Broker-Attorney-Realtor®
951-990-3998
MB Live Realty, Inc.
Note: All data in this report is from California Regional Multiple Listing Service (CRMLS) All information should be independently reviewed and verified for accuracy. This report is for informational purposes only and not intended as financial or investment advice.

No Comments