Area 2-Sunnyslope-Jurupa Valley Residential Real Estate Market Update-October 2023
Jurupa Valley 92509
Residential Real Estate Market Update
October 2023
Area of Focus:
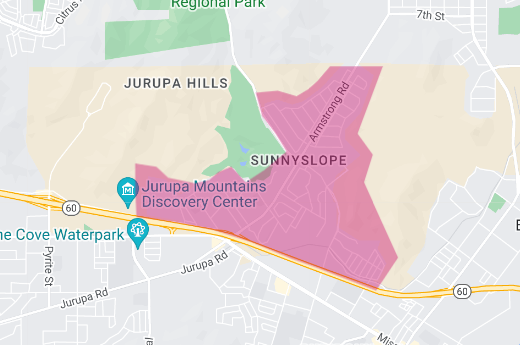
2-Sunnyslope (see map)
Market Summary
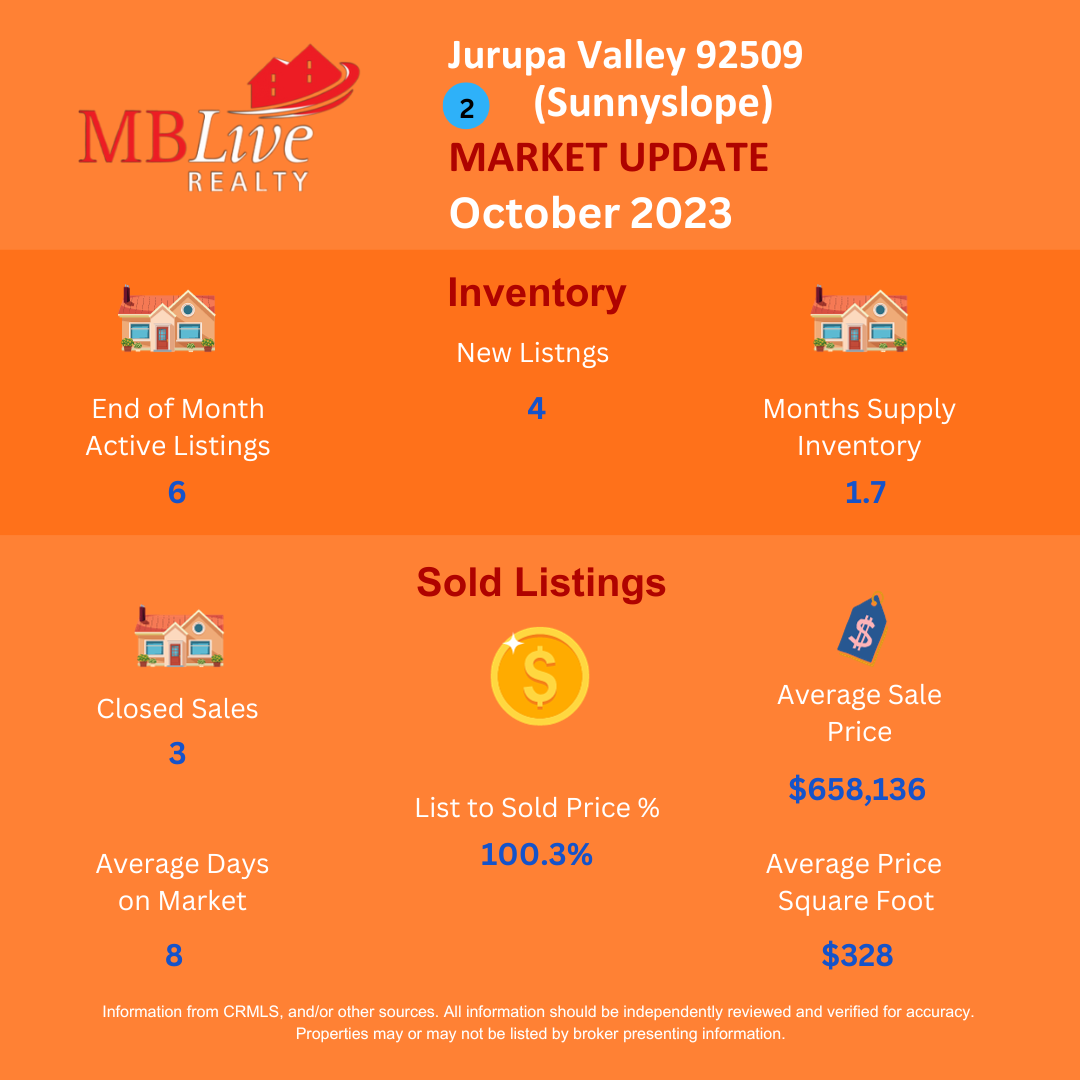
As of the end of October, Sunnyslope’s real estate market showcases a transformative season with notable shifts from last year. October’s metrics reflect a market that’s both dynamic and discerning, with a significant decrease in active listings and a remarkable efficiency in sales.
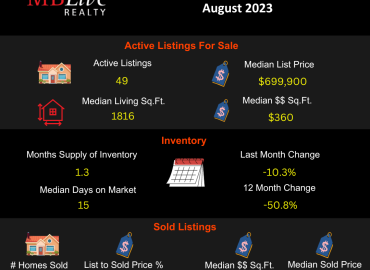
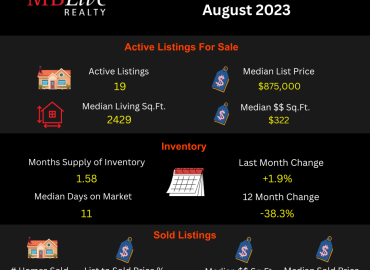
Active Listings Analysis
The end of October saw a remarkable 71.4% year-over-year decrease in active listings, settling at 6. This sharp decline from the previous year indicates a significantly more competitive market, where buyers have fewer options to choose from.
New Listings and Inventory
New listings in October experienced a 33.3% dip from last year, introducing 4 new homes to the market. This constriction in new inventory is echoed in the Months Supply Inventory, which at 1.7 represents a 57.5% decrease, clearly demand is outpacing supply at a rapid clip.
Sales Activity
Closed sales in October numbered 3, marking a 57.1% decrease compared to the previous year. Despite fewer sales, the efficiency of the market has improved dramatically with homes spending an average of just 8 days on the market, an 80.0% decrease from last year’s figures.
Pricing Trends
Reflecting the competitive nature of the market, the List to Sold Price percentage slightly exceeded the asking price at 100.3%, a positive change of +6.1% from last year. This indicates that sellers are getting their asking price and sometimes fetching more.
Average Sales Price
The average sales price in October was $658,136, up 12.3% from the previous year, underscoring the area’s increasing property values and the market’s upward trajectory.
Price Per Square Foot
The average price per square foot has seen a slight adjustment, coming in at $328, a decrease of 4.4% from last year. This minor retreat in price per square foot could signal a nuanced buyer market where pricing must be strategic.
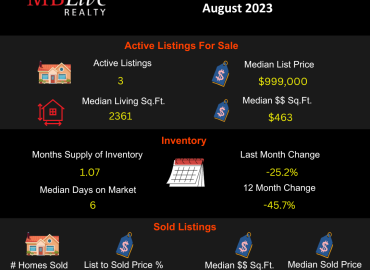
September 2023 Comparison
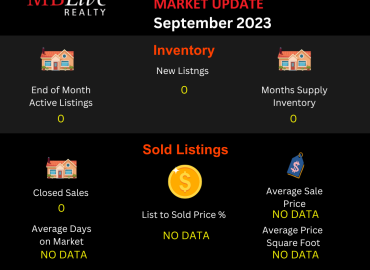
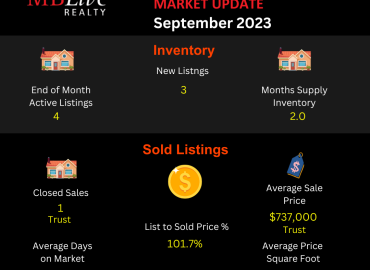
Contrasting with September, where active listings were at 9, October’s market is tighter. September’s closed sales were higher at 4, but the market was slower with homes averaging 36 days on the market, a stark contrast to October’s swift 8 days.
The List to Sold Price percentage in September stood at 91.2%, notably lower than October’s 100.3%, demonstrating a shift towards sellers’ favor as the season progressed.
Concluding Thoughts
The Sunnyslope real estate landscape is exhibiting signs of a seller’s market, with quick sales, above-list pricing, and rising average sales prices. However, buyers are discerning, as seen in the slight pullback in price per square foot.
Looking Forward
As we approach the end of 2023, Sunnyslope’s market is characterized by agility and vigor. For sellers, it’s a market ripe with opportunity, and for buyers, the call to action is clear — move swiftly and decisively.
For a comprehensive understanding of how these trends can impact your real estate decisions, contact me. I provide expert guidance and strategic insights and can guide you through these interesting times in real estate.
For a detailed and personalized analysis of your home, or if you have any questions, feel free to contact me. I am committed to providing accurate and updated information to assist you in all your real estate needs.
Manny Barba
Broker-Attorney-Realtor®
951-990-3998
MB Live Realty, Inc.
Note: All data in this report is from California Regional Multiple Listing Service (CRMLS) All information should be independently reviewed and verified for accuracy. This report is for informational purposes only and not intended as financial or investment advice.

No Comments