91752 Residential Real Estate Market Update (Jurupa Valley-Eastvale) November 2023
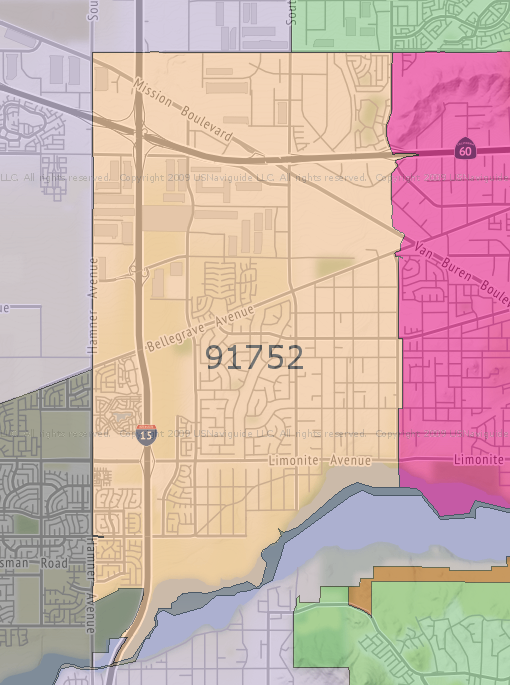
The 91752-zip code, located in Riverside County, California, encompasses a small part of the city of Eastvale (east of Hamner Avenue) and the western part of the city of Jurupa Valley (Mira Loma area). The history of the ’52 zip code is closely tied to the development of these communities. Here’s a brief overview:
Throughout the 19th and early 20th centuries, the area was predominantly agricultural. It was known for its dairy farms and fields of crops, which benefited from the region’s fertile soil and favorable climate.
After World War II and into the 20th century, like many areas in Southern California, the region began to transform. The growth of the Los Angeles metropolitan area, improvements in transportation, and the increasing demand for suburban housing led to the development of residential communities, eventually becoming the cities of Eastvale and Jurupa Valley.
Today, the 91752-zip code is characterized by its suburban residential communities, commercial developments, and remaining agricultural areas. It is a reflection of the larger trends in Southern California’s Inland Empire – a shift from rural to suburban and urban landscapes.
The history of the 91752-zip code is a microcosm of the broader changes in Southern California – from indigenous lands to agricultural heartland, to a thriving suburban area. It reflects the dynamic and ever-evolving nature of the region.
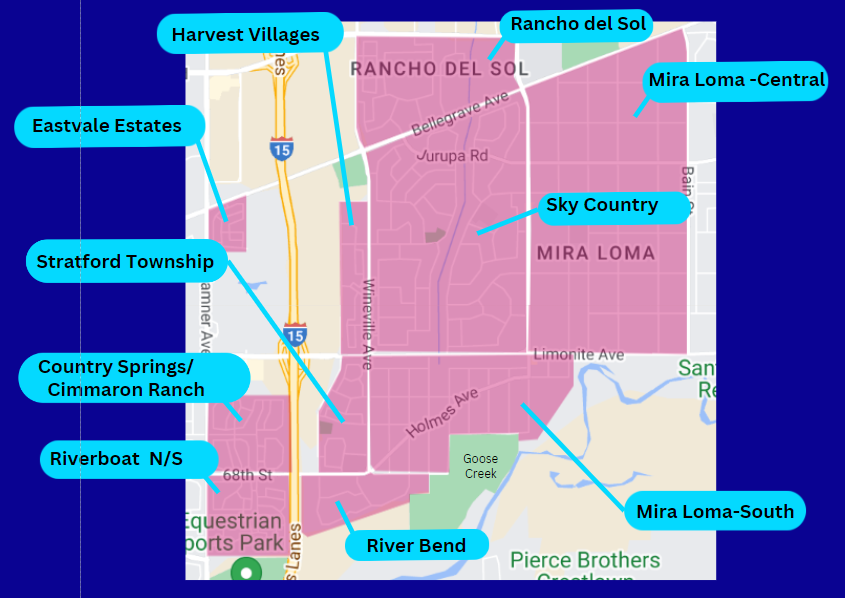
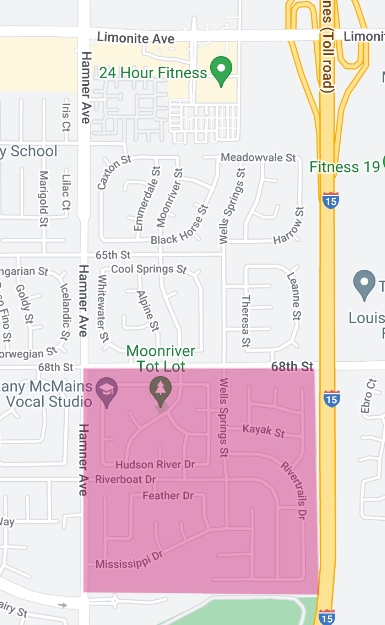
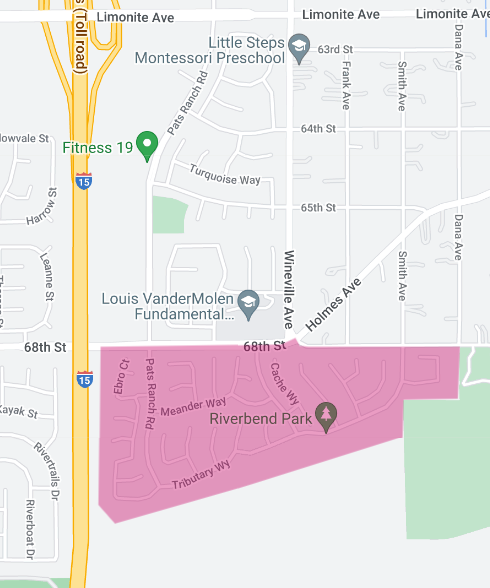
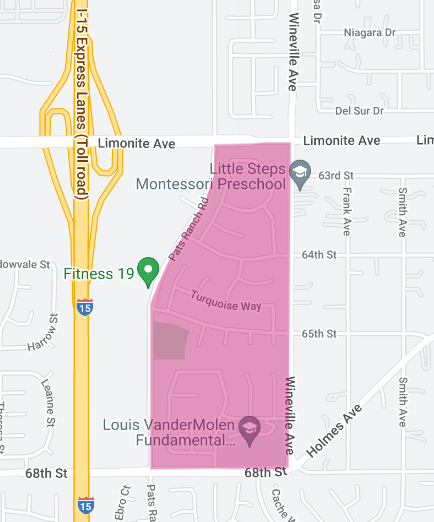
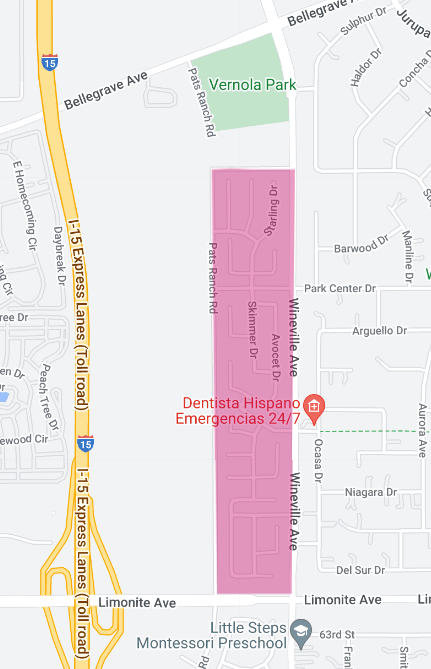
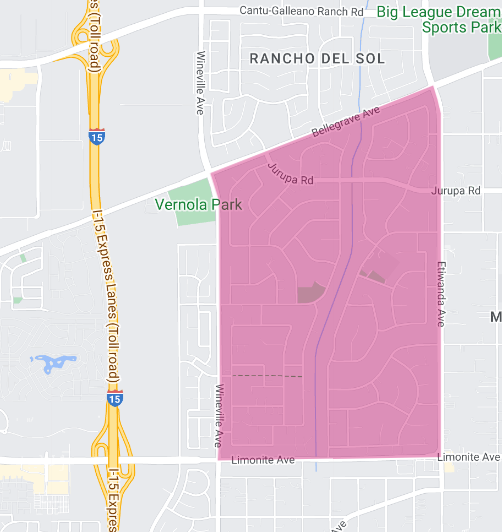
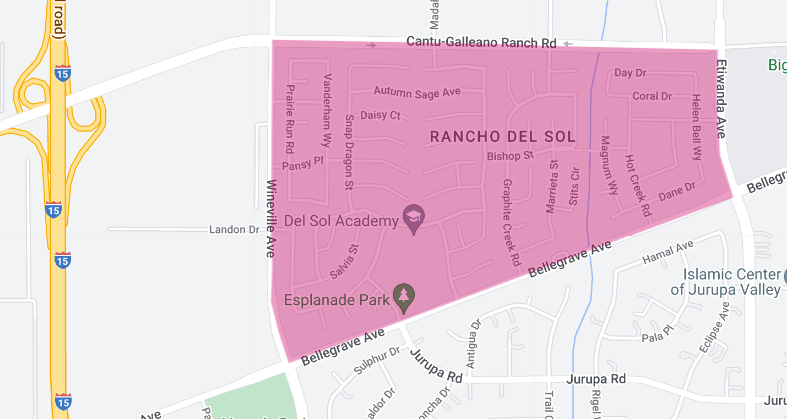
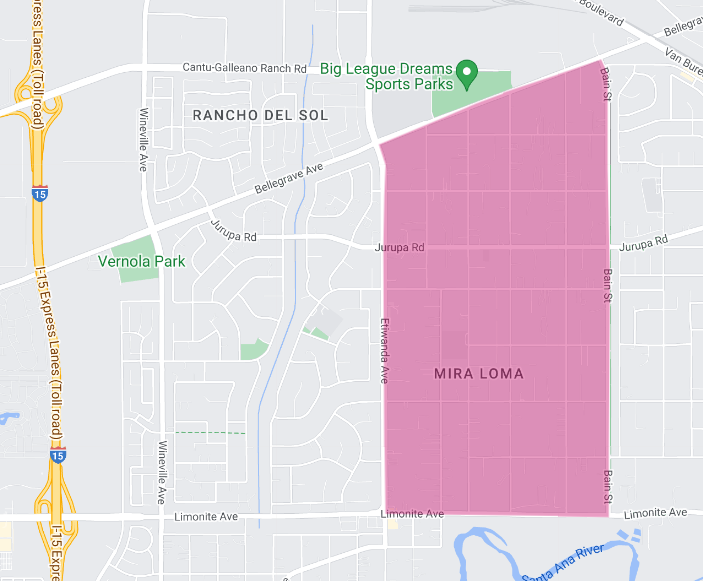
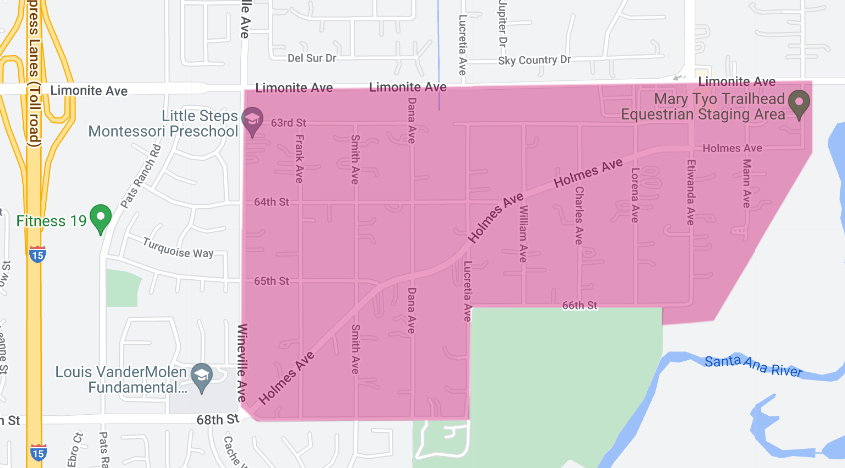
The image below shows the ten residential areas in the 91752 consisting of single family homes which is the focus of this report. Specifically, in the city of Eastvale, the homes adjacent to Riverboat Dr. (south of 68th St., east of Hamner Ave); the Country Springs/Cimmaron Ranch area (north of 68th St. and east of Hamner Ave.); and the Eastvale Estates area (south of Bellegrave Ave, east of Hamner Ave.). Also, in the city of Jurupa Valley, the River Bend tract (south of 68th St.), the Stratford Township tract (south of Limonite Ave, north of 68th St.); Harvest Villages (north of Limonite, west of Wineville Rd,); Sky Country; Rancho del Sol (north of Bellegrave, west of Etiwanda, south of Cantu Galleano, and east of Wineville Rd.); and original Mira Loma, central and south.
AREA: Eastvale Estates (Bellegrave Ave./Hamner Ave/)
Western Edge of 91752 ZIP Code, Eastvale, CA
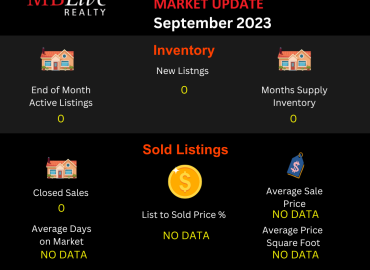
This report presents a focused analysis of the residential real estate market for Eastvale Estates, a community located on the western edge of the 91752 ZIP code in the City of Eastvale, for the month ending November 2023. The goal is to provide a clear and straightforward overview of the current market dynamics.
End of Month Active Listings:
There were zero active listings at the end of November 2023. This is a significant decrease of 100% compared to the same period last year. This indicates a complete absence of available properties for sale in the area at this time.
New Listings:
Similarly, there were no new listings in November 2023, also marking a 100% decrease from the previous year. This suggests no new market entries for potential buyers.
Months Supply of Inventory:
Because there are no active listings, there is no available data on the months’ supply of inventory. This metric usually helps gauge the balance between supply and demand in the housing market.
Closed Sales:
There were no closed sales for the month ending November 2023.
Average Days on Market:
Because there were no closed sales. there is no available data for the average number of days homes stayed on the market before being sold.
List to Sold Price Percentage:
Because there were no closed sales. there is no available data for list-to-sold price ratio.
Average Sales Price:
There is no data on the average sales price for November 2023.
Average Price per Square Foot:
No data is available to determine the average price per square foot.
Year-to-Date Sales:
Since January 1, 2023, three homes have been sold in the Eastvale Estates area. The average sales price of these homes was $795,333. This provides a broader view of the market over the past year.
Analysis:
The real estate market in Eastvale Estates for November 2023 is characterized by a complete lack of market activity in terms of listings and sales. This suggests that Eastvale Estates is a highly stable area with very little turnover in properties. The data from earlier in the year indicates that the few properties that were sold fetched substantial prices, reflecting the desirability of the area.
The Eastvale Estates residential area is currently experiencing an inactive market phase, with no new listings or sales recorded for November 2023. This could be indicative of a highly sought-after area where residents choose to remain in their homes long-term. While this creates a challenging environment for potential buyers due to the scarcity of options, it presents a potentially advantageous situation for homeowners considering selling, as past sales indicate a strong market value for properties in this area.
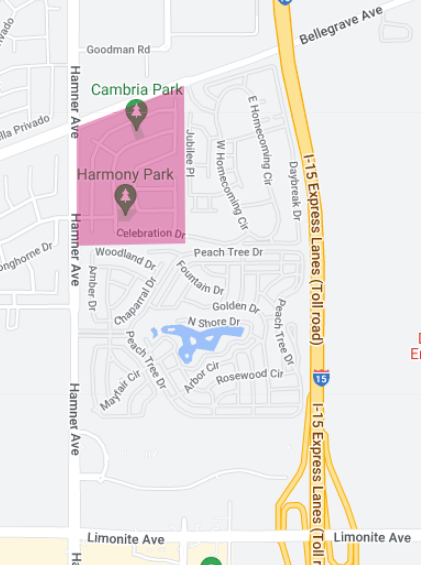
Area: Cimmaron Ranch/Country Springs
Western Edge of 91752 ZIP Code, Eastvale, CA
The following is a current overview of the residential real estate market for Cimmaron Ranch/Country Springs, located on the western edge of the 91752 ZIP code, for the month ending November 2023. The focus is to present an accessible yet professional analysis of the market trends based on the available metrics.
End of Month Active Listings:
There were 0 active listings at the end of November 2023. This marks a drastic 100% decrease from the same period last year, indicating a complete lack of available properties on the market at this time.
New Listings:
There were no new listings for November 2023. This contributes to the understanding of a stagnant market with no new properties entering the market during this period.
Months Supply of Inventory:
Currently, there is no data available for the months’ supply of inventory. This metric is typically used to gauge the balance between supply and demand in the housing market.
Closed Sales:
There were 0 closed sales in November 2023. This aligns with the absence of active and new listings, suggesting a period of inactivity in the market.
Average Days on Market:
No data is available for the average days on market for this period. This metric typically indicates the pace at which homes are selling.
List to Sold Price Percentage:
There is no available data for the list-to-sold price percentage, a metric that often reflects market competitiveness.
Average Sales Price: No data is available for the average sales price for November 2023.
Average Price per Square Foot: There is no current data for the average price per square foot, a common measure of property value relative to size.
Year-to-Date Sales:
Since January 1, 2023, five homes in the area have been sold. The average sales price of these homes was $858,577. This figure provides a broader context for the market conditions over the year.
Analysis:
The current market conditions in Cimmaron Ranch/Country Springs are highly unusual, characterized by a complete lack of active listings and sales activities for the month of November 2023. This could be indicative of a highly stable residential area with low turnover, where properties are rarely put up for sale. The data from earlier in the year suggests that when properties do come onto the market, they command high prices, as seen in the average sales price of the homes sold since January.
The real estate market in Cimmaron Ranch/Country Springs is currently in a state of inactivity, with no new listings, sales, or available properties as of November 2023. This stagnation suggests a very stable community but poses challenges for potential buyers due to the lack of available options. For potential sellers, the data indicates a potentially favorable market, should they choose to list their properties.
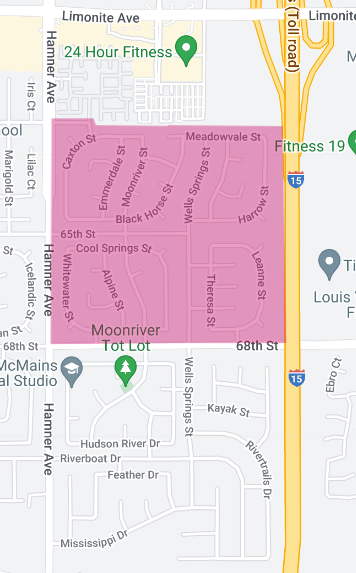
Area: Riverboat Dr. Area Homes
Western Edge of 91752 ZIP Code, Eastvale, CA
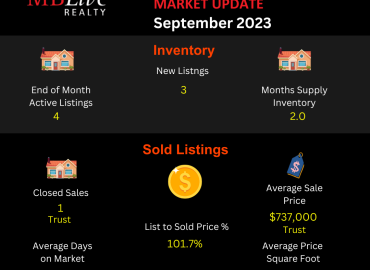
This report provides a comprehensive analysis of the residential real estate market surrounding Riverboat Drive in Eastvale, CA, for the month ending November 2023. Our focus is to offer a clear and concise overview, suitable for a wide range of stakeholders including homeowners, potential buyers, and investors.
End of Month Active Listings:
As of November 2023, there are 3 active listings in the area. This number represents a significant decrease of 50% from the same period last year. This reduction indicates a tightening market, with fewer options available for buyers.
New Listings:
There was 1 new listing in November 2023. This is in stark contrast to November of the previous year, where there were no new listings. This could suggest a slight opening in the market, though still limited in scope.
Months Supply of Inventory:
The current supply stands at 2.1 months. This is a substantial decrease of 41.7% compared to last year, signaling a shift towards a seller’s market. This metric measures how long the current inventory of properties would last at the current rate of sales if no new properties were listed.
Closed Sales:
There was 1 closed sale in November 2023. This compares to none in the same month last year, indicating some movement in the market, albeit limited.
Average Days on Market:
Properties are currently averaging 14 days on the market before being sold. This relatively short period suggests a robust demand in the market and a high level of interest in properties in this area.
List to Sold Price Percentage: The average list-to-sold price percentage is 96.4%. This high percentage indicates that properties are selling close to their asking price, a sign of a healthy and competitive market.
Average Sales Price:
The average sales price for properties sold (1) was $770,000. This value provides insight into the general pricing dynamics in the area and is crucial for both sellers setting prices and buyers preparing offers.
Average Price per Square Foot: The average price per square foot stands at $303. This metric is useful for comparing property values in a standardized way, irrespective of size differences.
Conclusion:
The residential real estate market adjacent to Riverboat Dr in Eastvale, CA, exhibits signs of a competitive market with limited inventory, quick sales, and prices close to the listing prices. The significant decrease in active listings and months’ supply inventory, combined with a consistent average sales price, suggests a seller’s market. This environment is likely to persist in the short term, making it an opportune time for sellers. Buyers, on the other hand, may face challenges due to the limited inventory and should be prepared for potential competition.
Area: River Bend Homes
Western Edge of Jurupa Valley 91752
River Bend
End of Month Active Listings
Total: 2
Year-over-Year Change: -50.0%
New Listings
Total: 0
Year-over-Year Change: -100.0%
Months Supply Inventory
Total: 1.0
Year-over-Year Change: +54.5%
Closed Sales
Total: 2
Comparative Data: 0 closed sales a year ago
Average Days on Market
Total: 48
Comparative Data: Not Available from last year
List to Sold Price Percentage
Total: 96.2%
Comparative Data: Not Available from last year
Average Sales Price
Total: $880,000
Comparative Data: Not Available from last year
Average Price per Square Foot
Total: $339
Comparative Data: Not Available from last year
The following is the residential real estate market update for the River Bend tract for the month ending November 2023. This report encapsulates the market dynamics, reflecting significant changes compared to the previous year.
To begin with, the end of the month active listings stands at just two homes, marking a substantial decrease of 50% from last year. This reduction signifies a tighter market with fewer choices for potential buyers.
Intriguingly, there were no new listings for the month, representing a 100% decline from the previous year. This situation further emphasizes the scarcity of available properties in River Bend, showing a high demand for homes in this area.
The month’s supply of inventory, a critical metric indicating the balance between supply and demand, shows an increase to 1.0, up 54.5% from last year. This increase suggests a slight easing in the market, providing a little more breathing room for buyers, albeit still indicating a seller’s market.
In terms of sales activity, there were two closed sales this month, in contrast to none a year ago. This activity, although modest, is a positive sign of market movement in the River Bend area.
The average days on market for homes sold was 48 days. Unfortunately, there is no comparative data from last year, but this figure suggests a relatively brisk pace for sales, with homes spending a moderate amount of time on the market before being sold.
The list to sold price percentage, an indicator of how close the final sale price is to the listing price, stands at 96.2%. This high percentage indicates that homes are selling close to their asking prices, a sign of a healthy market where buyers are willing to pay near the listed price.
The average sales price for homes in River Bend is notably high at $880,000. While there’s no comparative data from last year, this figure suggests a premium market segment in the area.
Finally, the average price per square foot comes in at $339, providing a solid benchmark for property values in the area, though, again, there’s no data from the previous year for comparison.
In summary, the River Bend residential real estate market in November 2023 shows signs of a robust, albeit tight market, with high property values and a quick turnaround in sales. The lack of new listings and a significant decrease in active listings have created a competitive environment, benefiting sellers with high sale prices close to their listing prices.
Area: Stratford Township Homes
Western Edge of Jurupa Valley 91752
End of Month Active Listings
Total: 4
Year-over-Year Change: +33.3%
New Listings
Total: 2
Comparative Data: Not available for last year
Months Supply Inventory
Total: 2.4
Year-over-Year Change: +60.0%
Closed Sales
Total: 0
Average Days on Market
Data: Not available
List to Sold Price Percentage
Data: Not available
Average Sales Price
Data: Not available
Average Price per Square Foot
Data: Not available
Additional Information:
From January 1 to November 30 of this year, there were 8 homes sold in this area with an average sales price of $787,375.
As we review the residential real estate market for the Stratford Township tract of homes for the month ending November 2023, the data presents an interesting picture of the current market dynamics.
This month, the Stratford Township area saw an end of month active listings count of four homes. This represents a significant increase of 33.3% compared to the same period last year. Such an increase indicates a more dynamic market, offering more options for potential buyers than the previous year.
In terms of new listings, there were two properties introduced to the market this month. Unfortunately, there’s no comparative data from last year to gauge the trend, but the addition of these new listings suggests some fresh opportunities for buyers in the area.
The months’ supply inventory, which measures how long the current inventory of homes would last at the current rate of sales, stood at 2.4. This is a considerable increase of 60.0% from last year, indicating a shift towards a more balanced market. Such an inventory level is often considered healthier, preventing the market from tipping too far in favor of either buyers or sellers.
A notable aspect of this month’s report is that there were zero closed sales in Stratford Township. This lack of sales activity could be attributed to a variety of factors, including market conditions, seasonal trends, or pricing strategies.
Unfortunately, for several key metrics such as average days on market, list to sold price percentage, average sales price, and average price per square foot, there’s no data available for this month. These metrics are crucial for understanding the pace of the market, the negotiation dynamics between buyers and sellers, and the overall value trend in the area.
However, looking at the broader picture from January 1 to November 30 of this year, there were a total of 8 homes sold in Stratford Township. These sales amassed an average sales price of $787,375. This figure provides valuable insight into the general pricing environment of the Stratford Township residential market and suggests a relatively high-value area.
In conclusion, the Stratford Township real estate market for November 2023 shows an increase in inventory and a slowdown in sales activity. The higher inventory levels, compared to last year, could potentially offer more choices for buyers.
However, the absence of recent sales and lack of data in key areas makes it challenging to draw definitive conclusions about the current market trend. The year-to-date sales figures, however, do suggest that Stratford Township remains an attractive and potentially high-value area for real estate investment.
Area: Harvest Villages
Western Edge of Jurupa Valley 91752
End of Month Active Listings
Total: 1
Year-over-Year Change: -66.7%
New Listings
Total: 0
Year-over-Year Change: 0.0%
Months Supply Inventory
Total: 0.8
Year-over-Year Change: -61.9%
Closed Sales
Total: 0
Year-over-Year Change: 0.0%
Average Days on Market
Data: Not available due to no closed sales
List to Sold Price Percentage
Data: Not available due to no closed sales
Average Sales Price
Data: Not available due to no closed sales
Average Price per Square Foot
Data: Not available due to no closed sales
Additional Information:
In the past six months, seven homes were sold in this area with an average sales price of $900,714.
This report reflects the current state of the market for the Harvest Villages track of homes, offering insights into the trends and shifts experienced over the past year.
Starting with the end-of-month active listings, Harvest Villages saw a notable decrease in available homes, with just one property on the market. This represents a significant 66.7% drop from the same time last year. Such a drastic reduction in inventory suggests a tight market where demand outstrips supply, potentially leading to competitive conditions for buyers.
Interestingly, there were no new listings in November, mirroring the situation from last year. This consistent lack of new inventory indicates a stagnant market in terms of new properties becoming available. For potential buyers, this means limited choices and possibly heightened competition for any new listings that might emerge.
The months’ supply inventory, which is a key indicator of market balance, stands at 0.8. This marks a substantial 61.9% decrease from the previous year, further highlighting the scarcity of homes in Harvest Villages. This metric signifies a seller’s market, where homes sell quickly due to high demand and low supply.
In terms of sales activity, there were zero closed sales this month, consistent with the previous year. This lack of sales activity is attributable to the limited inventory, with few options available for potential buyers.
Unfortunately, due to the absence of closed sales, we do not have data for average days on market, list to sold price percentage, average sales price, and average price per square foot for November. These metrics are crucial for understanding the overall health and pace of the market, and their absence makes it challenging to gauge the current market dynamics accurately.
However, looking at a broader timeframe, over the past six months, there have been 7 homes sold in Harvest Villages, with an average sales price of $900,714. This figure indicates a high-value market in the area, with properties commanding substantial prices. It also suggests that while monthly activity might be low, there is still a steady interest in the area over a longer period.
In conclusion, the Harvest Villages residential real estate market in November 2023 is characterized by a significant reduction in inventory and a consistent lack of new listings, maintaining the status quo from the previous year.
The low months’ supply inventory points towards a market heavily skewed in favor of sellers. While recent sales data is not available, the six-month average sales price indicates a robust market with high property values. Potential buyers in this market may face challenges due to the limited inventory and high demand.
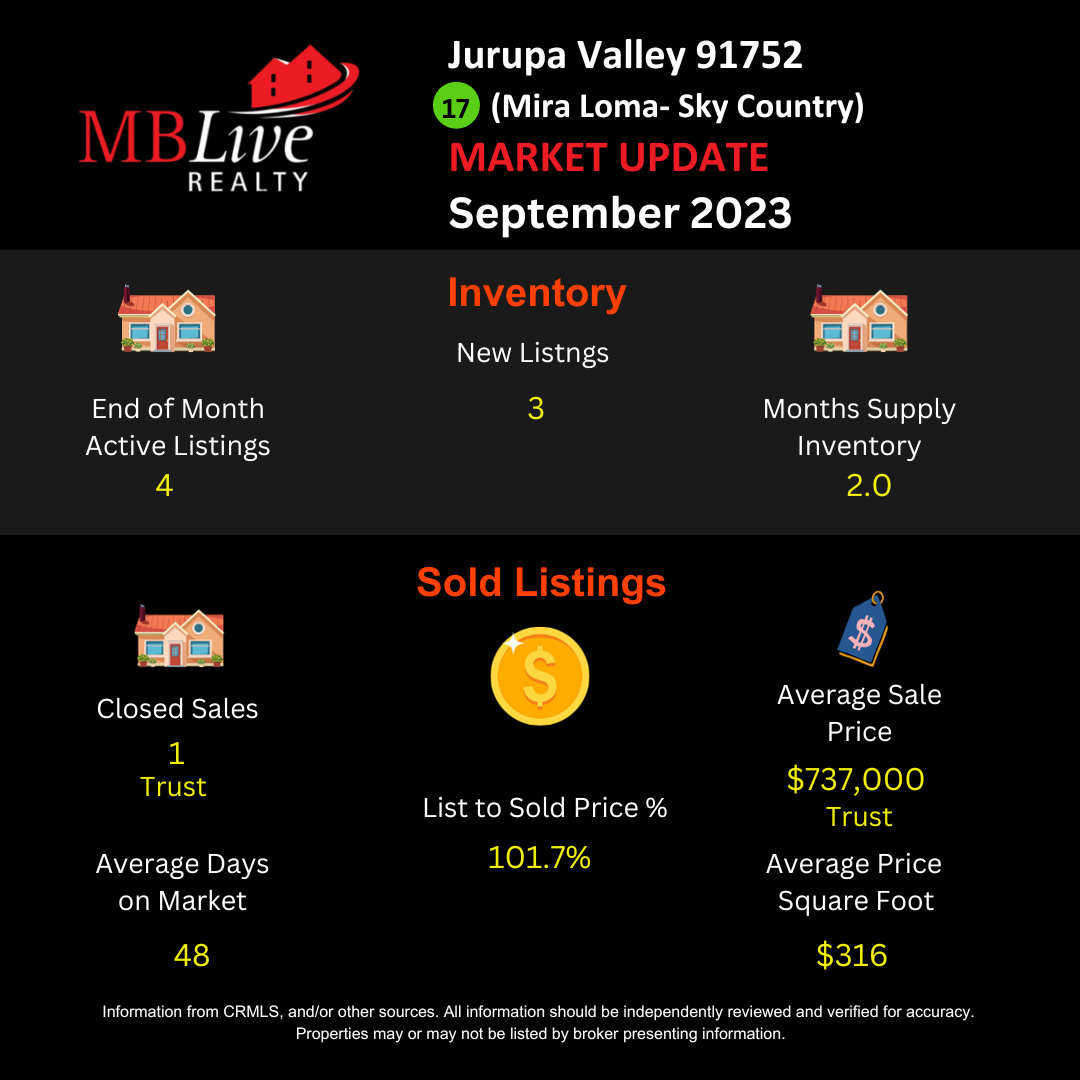
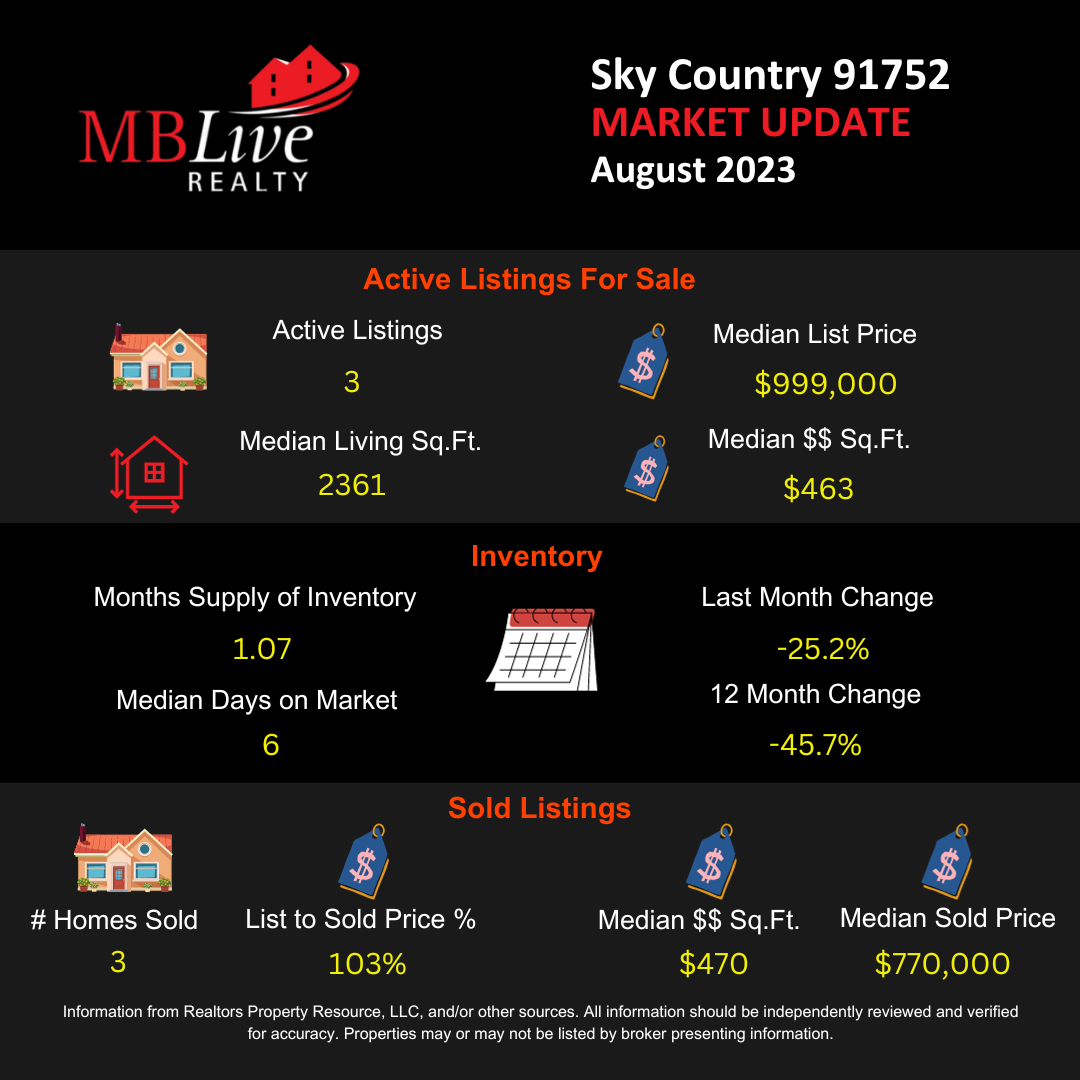
Area: Sky Country,
Western portion of Jurupa Valley 91752
End of Month Active Listings
Total: 4
Year-over-Year Change: -33.3%
New Listings
Total: 3
Year-over-Year Change: 0.0%
Months Supply Inventory
Total: 2.1
Year-over-Year Change: 0.0%
Closed Sales
Total: 2
Comparative Data: Not available from last year
Average Days on Market
Total: 21
Comparative Data: Not available from last year
List to Sold Price Percentage
Total: 97.7%
Comparative Data: Not available from last year
Average Sales Price
Total: $775,000
Comparative Data: Not available from last year
Average Price per Square Foot
Total: $447
Comparative Data: Not available from last year
As of the end of November 2023, the residential real estate market in the Sky Country tract of homes presents a dynamic and evolving landscape. This report synthesizes key metrics to offer a comprehensive overview of the current market status.
The end of the month active listings stood at 4, marking a significant decrease of 33.3% compared to the same period last year. This reduction in inventory suggests a tightening market, potentially leading to increased competition among buyers.
In terms of new listings, there were 3 homes introduced to the market in November, mirroring the same number from the previous year. This stability indicates a consistent flow of properties becoming available, which is crucial for maintaining a balanced market.
The months supply of inventory, a metric that measures how long the current inventory of homes would last at the current sales rate, was 2.1. This figure has remained unchanged from the previous year, suggesting a steady market condition.
Regarding sales activity, there were 2 closed sales during the month. Unfortunately, there is no comparative data from the previous year for this metric, but the current figure provides a baseline for future analysis.
The average days on market for homes in Sky Country was 21. This relatively swift turnover rate implies that homes are selling relatively quickly, which could be a sign of strong buyer demand and a competitive market environment.
The list to sold price percentage, an indicator of how close the final sale price is to the original listing price, was 97.7%. This high percentage indicates that homes are selling very close to their asking prices, a trend often seen in seller’s markets.
The average sales price for homes in the tract was an impressive $775,000. While there is no comparative data from the previous year, this figure sets a precedent for the perceived value and demand in the area.
Finally, the average price per square foot was calculated at $447, which provides a valuable benchmark for assessing property values in Sky Country on a more granular level.
In summary, the Sky Country residential real estate market for November 2023 demonstrates a robust and active environment, characterized by a lower inventory, stable new listings, rapid sales, and high sale prices close to listing prices.
This data paints a picture of a competitive market likely favorable to sellers, with a steady influx of properties maintaining a balanced dynamic.
Area: Rancho Del Sol area of homes,
Western portion of Jurupa Valley 91752
End of Month Active Listings
Total: 8
Year-over-Year Change: -42.9%
New Listings
Total: 5
Year-over-Year Change: +400.0%
Months Supply Inventory
Total: 3.5
Year-over-Year Change: -27.1%
Closed Sales
Total: 1
Year-over-Year Change: -50.0%
Average Days on Market
Total: 63
Year-over-Year Change: +40.0%
List to Sold Price Percentage
Total: 102.2%
Year-over-Year Change: +3.5%
Average Sales Price
Total: $766,000
Year-over-Year Change: -22.6%
Average Price per Square Foot
Total: $312
Year-over-Year Change: +22.8%
The residential real estate market in the Rancho del Sol area, as of November 2023, exhibits a unique blend of trends and shifts, reflecting the dynamic nature of the real estate landscape. This report aims to provide a holistic view of the market based on the above metrics.
Beginning with the end of month active listings, there were 8 properties available, which signifies a substantial decrease of 42.9% from last year. This sharp decline in inventory is a clear indicator of a contracting market, possibly leading to increased competition among potential buyers.
A remarkable surge was observed in the new listings, which stood at 5 for the month. This represents a significant 400% increase from the previous year, indicating a revitalization in the number of homeowners willing to sell. Such an influx could be due to various market forces and homeowner confidence in the current real estate climate.
The months supply of inventory, a crucial indicator of market balance, was 3.5. This figure has decreased by 27.1% compared to last year, suggesting a faster-moving market favoring sellers.
In terms of sales activity, the area witnessed only 1 closed sale, marking a 50% decrease from the previous year. This reduction could be attributed to various factors, including the limited inventory, interest rates, and possibly more selective buyers.
The average days on market for homes in Rancho del Sol was 63, which is a 40% increase from the previous year. This longer duration on the market might indicate some buyer hesitancy or a mismatch between buyer expectations and the properties available.
An interesting development is seen in the list to sold price percentage, which was 102.2%, showing a 3.5% increase. This means, on average, homes sold for more than their listing price, reflecting a competitive market where buyers are willing to pay a premium.
The average sales price was noted at $766,000, which is a 22.6% decrease from the previous year. This reduction in average sales price might be due to a variety of factors, including changes in the types of homes sold or overall market adjustments.
Lastly, the average price per square foot stood at $312, marking a significant increase of 22.8% from the previous year. This increase indicates a rise in property values on a per-unit-area basis, which might be attributed to higher demand for certain types of properties or improvements in the overall quality of available homes.
In summary, the Rancho del Sol real estate market in November 2023 presents a complex picture. While there is a notable decrease in active listings and closed sales, there is a surge in new listings and a significant increase in the list to sold price ratio. The market dynamics suggest a shifting environment with varying factors influencing buyer and seller behaviors.
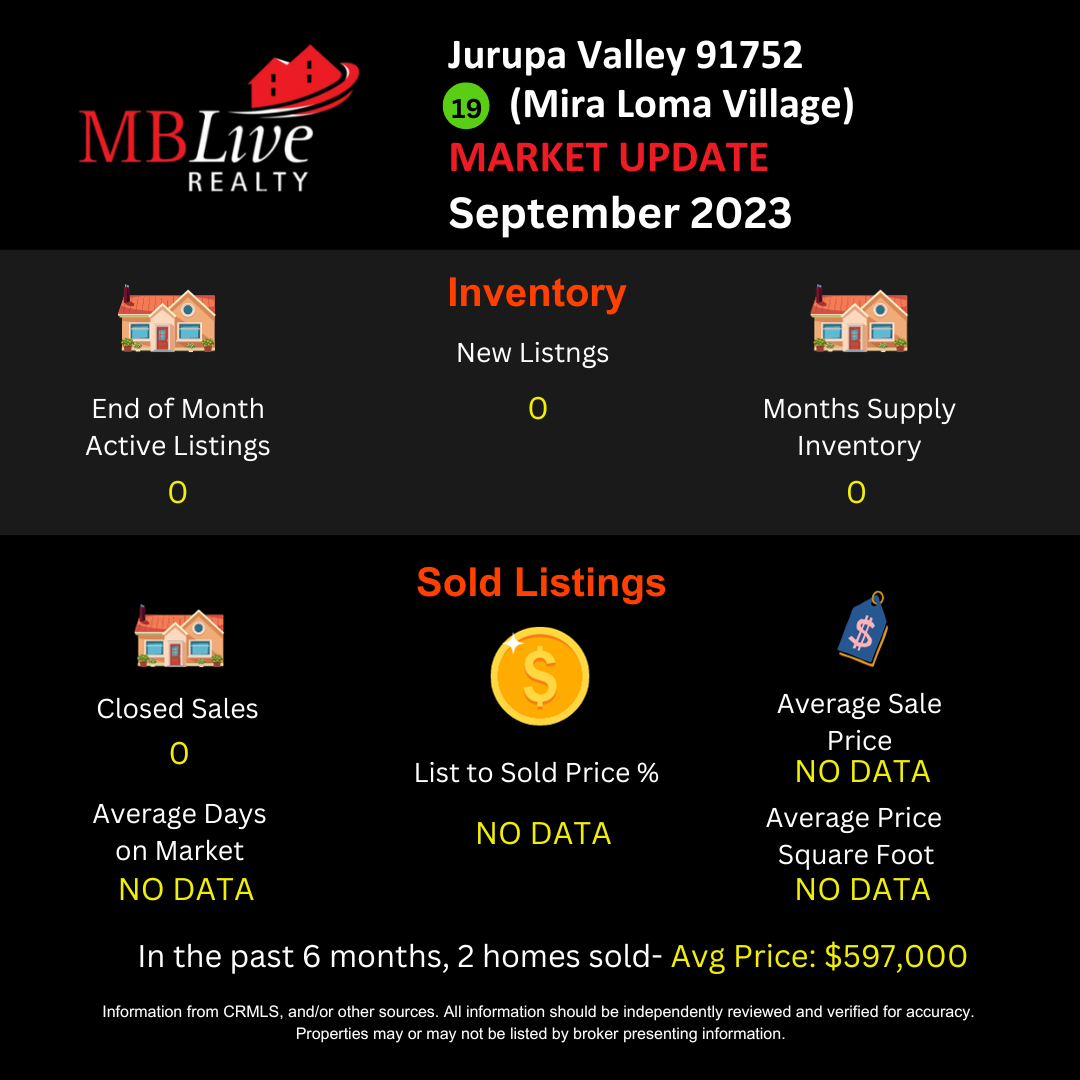
Area: Central Mira Loma (original)
Western portion of Jurupa Valley 91752
End of Month Active Listings
Total: 2
Year-over-Year Change: -71.4%
New Listings
Total: 2
Year-over-Year Change: 0.0%
Months Supply Inventory
Total: 1.2
Year-over-Year Change: -26.7%
Closed Sales
Total: 0
Year-over-Year Change: 0.0%
Average Days on Market
Data: Not Available
List to Sold Price Percentage
Data: Not Available
Average Sales Price
Data: Not Available
Average Price per Square Foot
Data: Not Available
Additional Note:
In the last six months, 10 homes have sold in this area with an average sales price of $718,100.00.
This report delves into the key metrics that define the current market status, offering insights into the trends and movements within this specific real estate landscape.
The end of month active listings in original Mira Loma stood at just 2, which is a dramatic decrease of 71.4% compared to last year. This substantial drop in available properties indicates a significantly tighter market, potentially leading to more competition among buyers for the few available homes.
In terms of new listings, there were 2 homes introduced to the market in November. This figure remains unchanged from the previous year, suggesting a consistent level of homeowners willing to sell. The stability in new listings, despite the overall reduction in active listings, could be indicative of a balanced flow of properties entering the market.
The months supply of inventory, a critical indicator of the balance between supply and demand, was notably low at 1.2. This represents a 63.6% decrease from the previous year, suggesting a market that is moving quite rapidly. A lower months supply typically points towards a seller’s market, where demand outweighs supply.
An interesting aspect to note is that there were no closed sales in November, consistent with the same period last year. This lack of sales activity could be due to various factors, including possibly stringent market conditions, interest rates, or a mismatch between buyer expectations and the properties available.
Unfortunately, data regarding the average days on market, list to sold price percentage, average sales price, and average price per square foot for the month were not available. This absence of data limits the depth of analysis that can be provided for these specific aspects of the market.
However, to provide a broader perspective, it is notable that in the last six months, 10 homes have been sold in the area. The average sales price for these homes was $718,100.00. This figure offers valuable insight into the recent market dynamics and the level of demand in the area. The average sales price reflects the value buyers attribute to properties in original Mira Loma, potentially influenced by factors like location, property features, and prevailing market conditions.
In conclusion, the real estate market in the original Mira Loma area, as of November 2023, is characterized by a significantly reduced inventory and stable new listings, with recent sales data suggesting robust property values. The lack of sales in the month and the sharply reduced inventory point towards a market that may be experiencing tight conditions, possibly favoring sellers in terms of pricing and negotiation leverage.
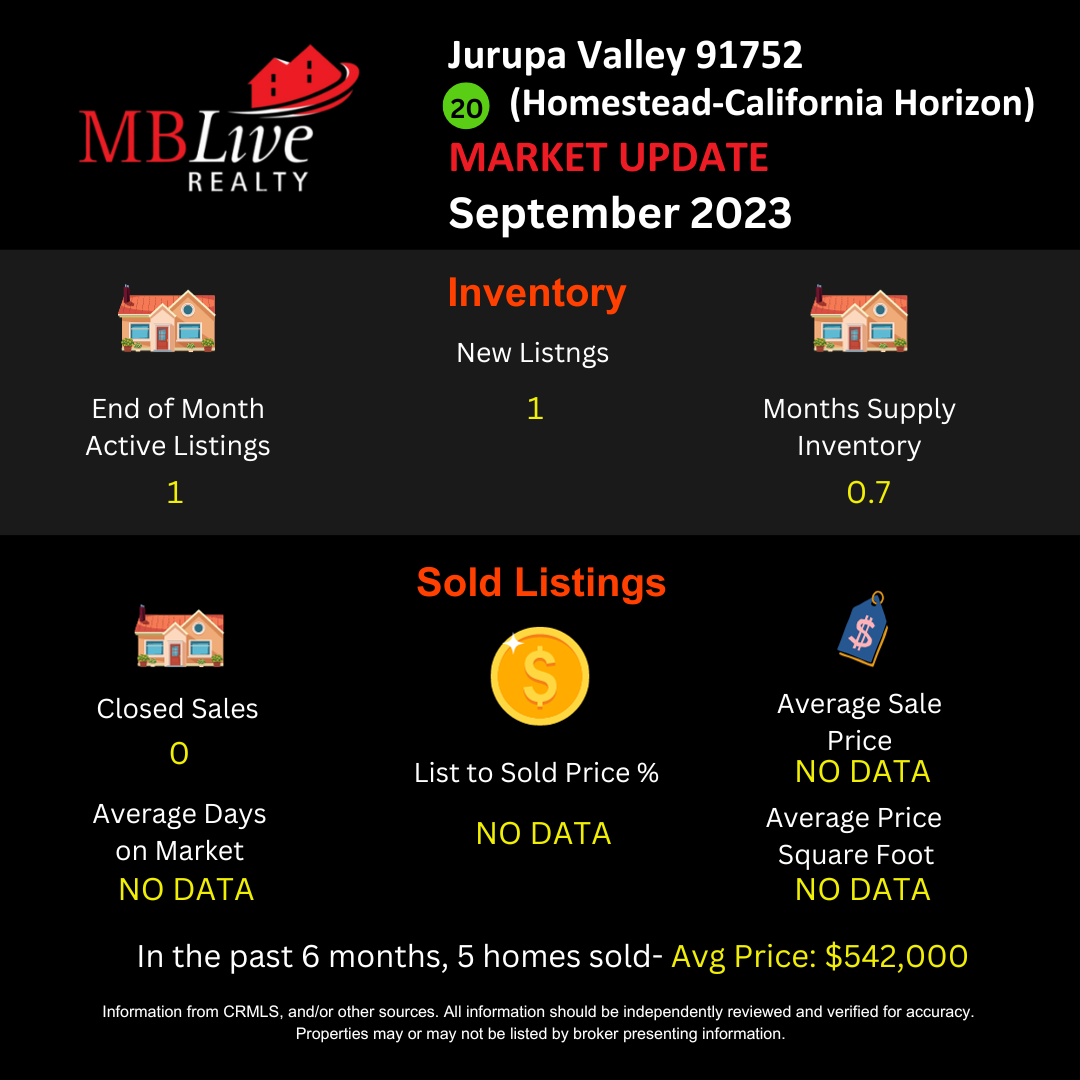
Area: Mira Loma – South (original)
Western portion of Jurupa Valley 91752
End of Month Active Listings
Total: 1
Year-over-Year Change: -66.7%
New Listings
Total: 1
Year-over-Year Comparison: Data Not Available
Months Supply Inventory
Total: 0.9
Closed Sales
Total: 0
Year-over-Year Change: -100%
Average Days on Market
Data: Not Available
List to Sold Price Percentage
Data: Not Available
Average Sales Price
Data: Not Available
Average Price per Square Foot
Data: Not Available
Additional Note:
In the past six months, 3 homes were sold in this area, with an average sale price of $601,666.
As November 2023 concludes, the residential real estate market in the Mira Loma-South area provides an intriguing picture of current trends and movements. This narrative report aims to encapsulate the nuances of this specific market, based on the available metrics.
Starting with the end of month active listings, there was just 1 property on the market, indicating a steep decrease of 66.7% from the previous year. This significant reduction in available homes suggests a notably tight market, which could lead to increased competition among buyers due to the scarcity of options.
In terms of new listings, there was only 1 new entry in November. Unfortunately, there is no data from last year to compare this figure with. However, the introduction of a single property in the current market landscape may reflect a cautious approach by sellers or perhaps a unique situation within the community.
The months supply of inventory stood at a notably low 0.9. This metric, which measures how long the current inventory of homes would last at the current sales pace, suggests a rapidly moving market. Typically, a months supply of less than 4-6 months indicates a seller’s market, where demand outstrips supply.
A critical point to note is that there were no closed sales in November, which is a 100% decrease from the previous year. This lack of sales activity could be attributed to a variety of factors, including potential buyer hesitancy, pricing issues, or the limited number of available properties.
Unfortunately, we do not have data for the average days on market, list to sold price percentage, average sales price, and average price per square foot for November 2023. The absence of these metrics limits our ability to analyze the market’s speed, pricing dynamics, and overall value trends for this specific period.
To offer a broader perspective, over the past six months, 3 homes have been sold in the original Mira Loma-South area. The average sale price of these homes was $601,666. This figure provides a glimpse into the value ascribed to properties in the area and suggests a market where homes, albeit few, are still commanding significant prices.
In conclusion, the real estate market in the original Mira Loma-South area for November 2023 is characterized by an extremely limited inventory and a complete absence of sales in the month.
The market dynamics indicate a challenging environment, potentially skewed in favor of sellers due to the low supply. The average sale price over the past six months offers a snapshot of the market’s value level, although the current lack of activity suggests a need for careful analysis for both potential buyers and sellers moving forward.
*****
For a comprehensive understanding of how the trends above can impact your real estate decisions, contact me. I provide expert guidance and strategic insights and can guide you through these interesting times in real estate.
For expert guidance, strategic insights, or a detailed and personalized analysis of your home, or if you have any questions, feel free to contact me. I am committed to providing accurate and updated information to assist you in all your real estate needs.
Manny Barba
Broker-Attorney-Realtor®
951-990-3998
MB Live Realty, Inc.
Note: All data in this report is from California Regional Multiple Listing Service (CRMLS) All information should be independently reviewed and verified for accuracy. This report is for informational purposes only and not intended as financial or investment advice.

No Comments