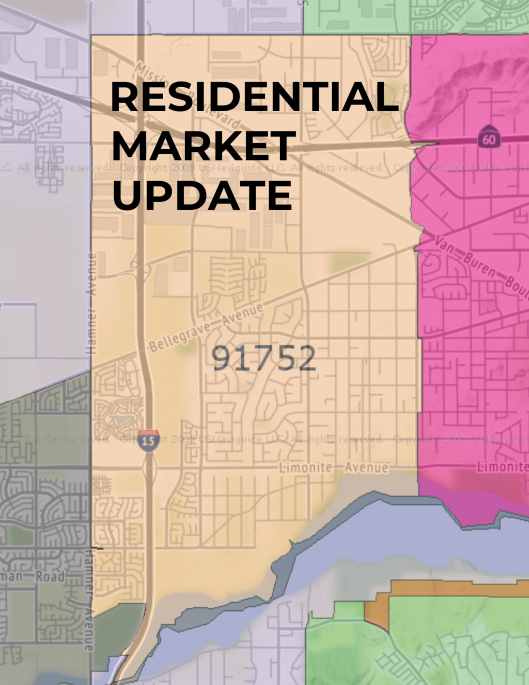
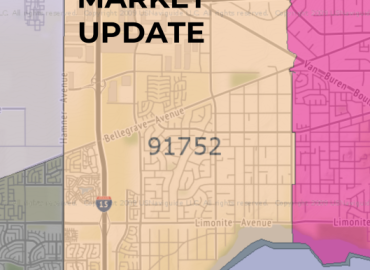
91752 Residential Real Estate Market Update (Jurupa Valley-Eastvale) – April 2024
The 91752-zip code, located in Riverside County, California, encompasses a small part of Eastvale (east of Hamner Avenue) and the western part of Jurupa Valley (Mira Loma area). The history of the ’52 zip code is closely tied to the development of these communities. Here’s a brief overview:
Throughout the 19th and early 20th centuries, the area was predominantly agricultural. It was known for its dairy farms and fields of crops, which benefited from the region’s fertile soil and favorable climate.
After World War II and into the 20th century, the region began to transform like many areas in Southern California. The growth of the Los Angeles metropolitan area, transportation improvements, and the increasing demand for suburban housing led to the development of residential communities, eventually becoming the cities of Eastvale and Jurupa Valley.
Today, the 91752-zip code is characterized by its suburban residential communities, commercial developments, and remaining agricultural areas. It reflects the more significant trends in Southern California’s Inland Empire – a shift from rural to suburban and urban landscapes.
The history of the 91752-zip code is a microcosm of the broader changes in Southern California – from indigenous lands to agricultural heartland to a thriving suburban area. It reflects the dynamic and ever-evolving nature of the region.
The following data is not intended to be a comparative market analysis for any one particular home but instead gives a general valuation for homes in each of the 12 specified areas and the entire residential areas located in the 91752-zip code.
For a detailed and personalized market analysis of your home, or if you have any questions, please get in touch with me.
Manny Barba,
Broker-Attorney-Realtor®
DRE #00879806
951-990-3998
mail@mbliverealty.com
MB Live Realty, Inc.
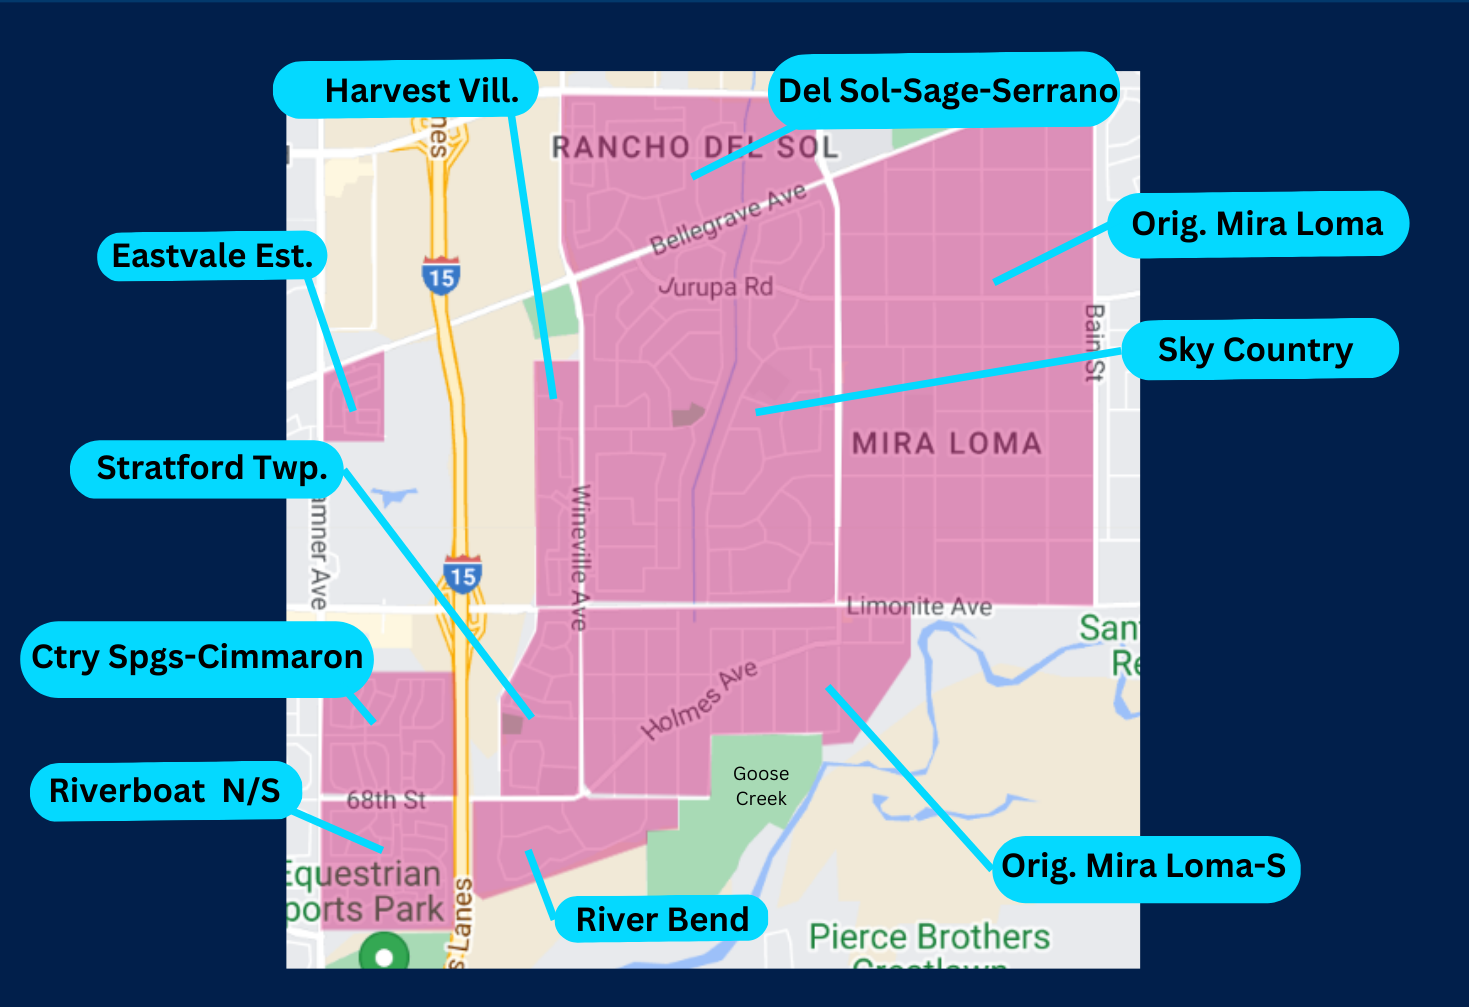
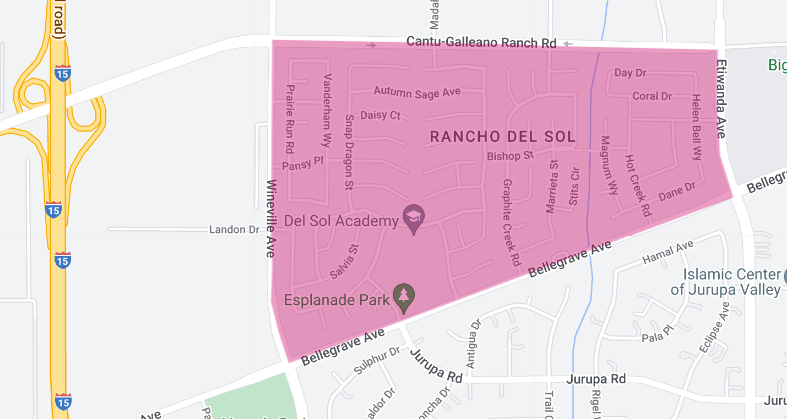
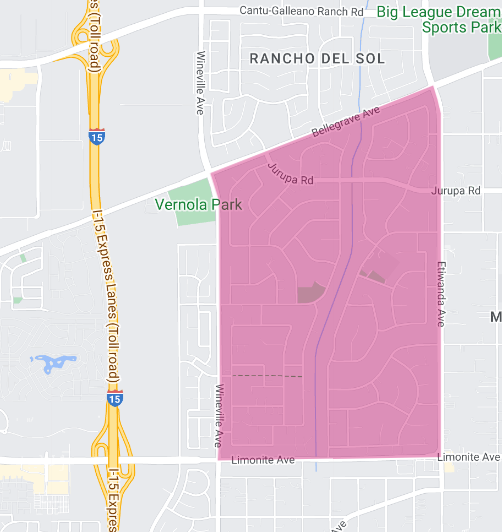
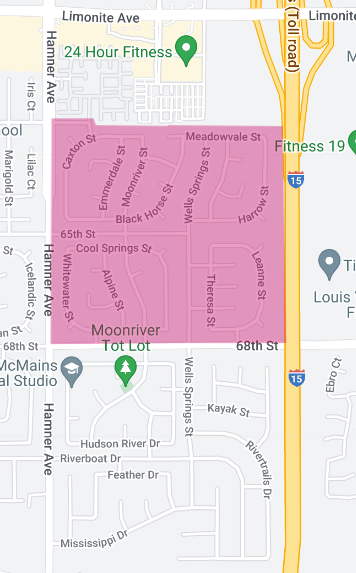
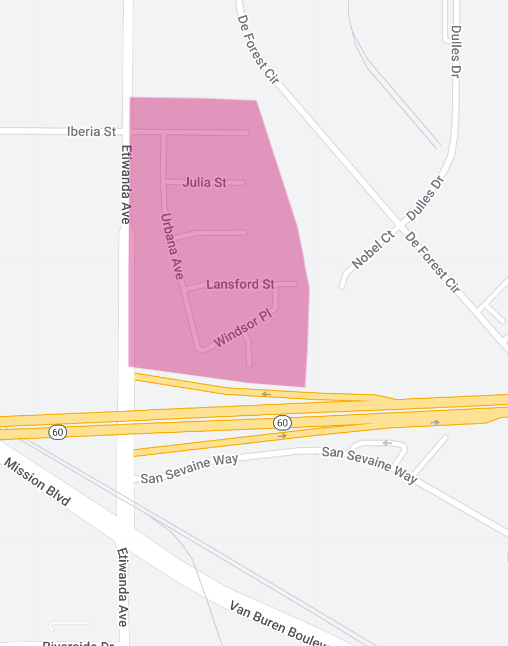
Area 1: Rancho Del Sol-Sage Pointe-Serrano Ranch area of homes,
(Western portion of Jurupa Valley 91752 )
End of Month Active Listings: 6, +20.0% change from last year
New Listings: 5 , +150.0% change from last year
Months Supply Inventory: 2.6, +44.4% change from last year
Closed Sales: 4 , +300.0% change from last year
Average Days on Market: 7, -63.2% change from last year
List to Sold Price %: 102.9% , +2.9% change from last year
Average Sales Price: $873,750, +1.6% change from last year.
Average Price Square Foot: $344, +47.0 change from last year.
In the vibrant Rancho Del Sol-Sage-Serrano Ranch residential area, April 2024 witnessed noteworthy shifts, marking another dynamic month in our local real estate landscape. Here’s a comprehensive overview of the key metrics that defined the market dynamics for the month ending April 2024.
Active Listings:
At the end of April 2024, the area boasted a total of 6 active listings, representing a significant increase of 20.0% compared to the same period last year. This uptick in available properties presents diverse opportunities for prospective buyers seeking their ideal residence within this community.
New Listings:
April 2024 saw the introduction of 5 new listings, showcasing a remarkable surge of 150.0% from the previous year. This influx of fresh properties entering the market underscores the sustained interest and confidence in this region’s real estate market.
Months Supply Inventory:
The months’ supply of inventory stood at 2.6, indicating a notable uptick of 44.4% compared to the preceding year. While this increase signifies a greater number of housing options for buyers, it also reflects a balanced market dynamic catering to both buyers and sellers.
Closed Sales:
Four (4) closed sales were recorded in April 2024, marking a substantial increase of 300.0% from the same period last year. This surge in closed transactions highlights the continued robust activity within this market area, fueled by strong buyer demand and favorable market conditions.
Average Days on Market:
The average days on market experienced a significant decrease, standing at 7 days, reflecting a remarkable decline of 63.2% compared to the previous year. This swift turnaround time underscores the efficiency and competitiveness of our market, presenting advantageous conditions for sellers.
List to Sold Price %:
The list to sold price percentage reached 102.9%, indicating a modest increase of 2.9% from the prior year. This upward trend signifies the resilience of property values in our area, coupled with the ability of sellers to secure favorable returns on their investments.
Average Sales Price:
The average sales price for residential properties in April 2024 settled at $873,750, demonstrating a steady increase of 1.6% compared to the same period last year. This incremental growth reflects the enduring desirability and value appreciation of homes within this market area.
Average Price per Square Foot:
The average price per square foot surged to $344, marking a substantial increase of 47.0% from the previous year. This escalation underscores the premium placed on residential properties in our area, reflecting both the quality of housing stock and the attractiveness of our neighborhood.
Conclusion:
April 2024 showcased a dynamic residential real estate market in the Rancho Del Sol-Sage-Serrano Ranch area, characterized by increased inventory, heightened buyer activity, and sustained value appreciation. As we navigate these evolving market dynamics, this residential market remains a sought-after destination for discerning buyers and investors alike.
Note: The above data is not intended to be a comparative market analysis for any one particular home. The above data provides an average valuation for homes sold in this area for the specified period.
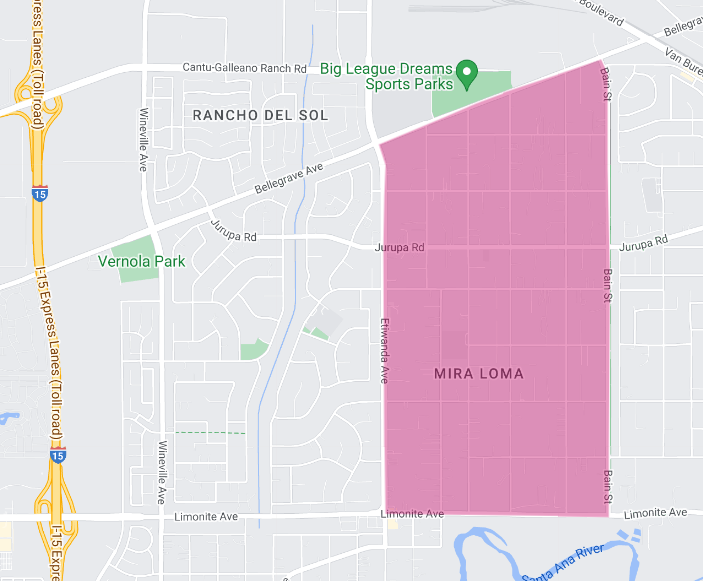
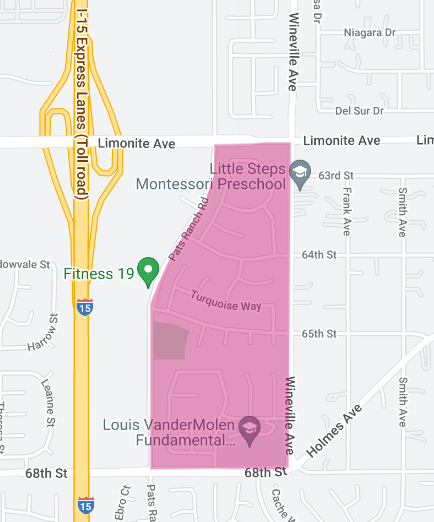
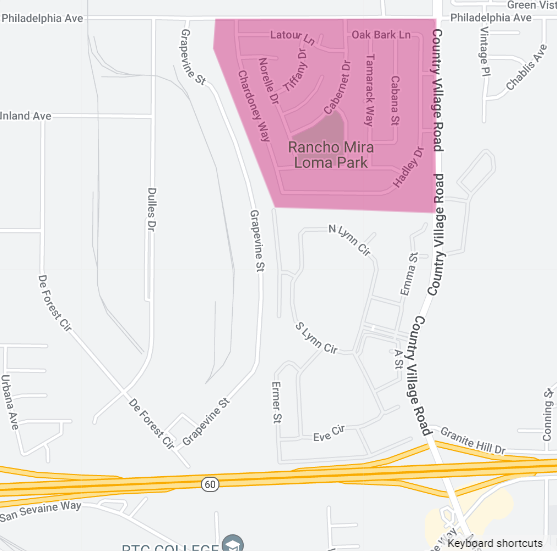
Area 2: Central Mira Loma (original)
(Western portion of Jurupa Valley 91752)
End of Month Active Listings: 0, -100.0% change from last year
New Listings: 1 , -66.7% change from last year
Months Supply Inventory: no data
Closed Sales: 1 , 0.0% change from last year
Average Days on Market: 93, +14.8%
List to Sold Price %: 94.2%, +17.8%
Average Sales Price: $685,000, +13.0% change from last year, calculated using a rolling 6-month average.
Average Price Square Foot: $476, +5.1% change from last year, calculated using a rolling 6-month average.
As we review the residential real estate market in the original Mira Loma residential area for the month ending April 2024, we observe a market characterized by unique dynamics and subtle shifts. Here’s a detailed analysis of the key metrics that shaped this local housing market during this period.
Active Listings:
At the close of April 2024, the Mira Loma area witnessed a noteworthy absence of active listings, with no properties currently available on the market. This represents a substantial decline of 100.0% compared to the same period last year, indicating a significant reduction in housing inventory within this community.
New Listings:
Only one (1) new listing entered the market in April 2024, marking a decline of 66.7% from the previous year. This decrease in new listings suggests a more restrained pace of property introductions, potentially influenced by various market factors such as seller sentiment and prevailing economic conditions.
Months Supply Inventory:
Unfortunately, specific data regarding the months’ supply of inventory for Mira Loma is not available for this reporting period.
Closed Sales:
April 2024 recorded one (1) closed sale, indicating stability with no change from the previous year. Despite the limited inventory, this consistent level of closed transactions underscores the resilience of buyer activity within this community.
Average Days on Market:
The average days on market increased to 93 days, reflecting a moderate uptick of 14.8% compared to the prior year. This extended timeframe suggests a slightly lengthier period for properties to attract suitable buyers, potentially influenced by evolving market conditions and buyer preferences.
List to Sold Price %:
The list to sold price percentage rose to 94.2%, representing a notable increase of 17.8% from the previous year. This upward trend indicates sellers’ ability to secure a higher percentage of their listing price during the negotiation process, highlighting the strength of the local market despite limited inventory.
Average Sales Price:
The average sales price for residential properties in Mira Loma reached $685,000 in April 2024, demonstrating a robust increase of 13.0% compared to the same period last year. This figure, calculated using a rolling 6-month average, reflects sustained appreciation in property values within this residential market, offering favorable returns for homeowners and investors alike.
Average Price per Square Foot:
The average price per square foot climbed to $476, showcasing a steady increase of 5.1% from the previous year, calculated using a rolling 6-month average. This upward trajectory in price per square foot reflects the enduring desirability and value proposition of homes in Mira Loma, further reinforcing our reputation as a sought-after residential destination.
Conclusion:
April 2024 presented a nuanced residential real estate market in Mira Loma, characterized by limited inventory, stable buyer activity, and appreciating property values. As we navigate these evolving market dynamics, this residential market remains an attractive option for both buyers and sellers, offering a blend of desirable homes and favorable investment opportunities.
Note: The above data is not intended to be a comparative market analysis for any one particular home. The above data provides an average valuation for homes sold in this area for the specified period.
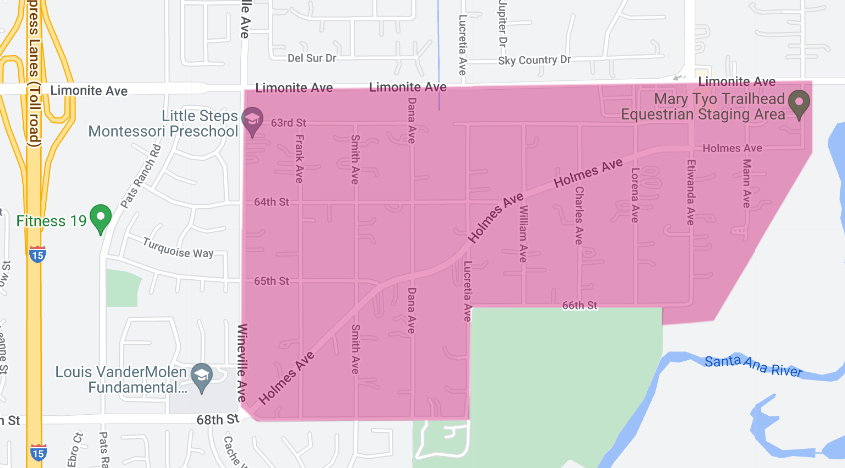
Area 3: Sky Country,
(Western portion of Jurupa Valley 91752 )
End of Month Active Listings: 4, +300.0% change from year ago,
New Listings: 2, 0.0% change from year ago,
Months Supply Inventory: 2.4 +500.0% change from year ago,
Closed Sales: 0 , -100.0% change from a year ago,
Average Days on Market: 22, +175.0% change from year ago, calculated using a rolling 3-month average.
List to Sold Price %: 103.7%, +5.3% change from year ago, calculated using a rolling 3-month average.
Average Sales Price: $753,750, -3.7% change from year ago, calculated using a rolling 3-month average.
Average Price Square Foot: $427, -0.5% change from a year ago, calculated using a rolling 3-month average..
As we conclude the month of April 2024, the Sky Country residential area presents a nuanced real estate landscape marked by notable shifts and trends. Let’s delve into the key metrics that defined the market dynamics for this period.
Active Listings:
At the end of April 2024, the Sky Country neighborhood boasted a total of 4 active listings, reflecting a substantial increase of 300.0% compared to the same period last year. This surge in available properties signals a heightened inventory level, providing buyers with an expanded array of housing options to consider.
New Listings:
Two (2) new listings were introduced to the market in April 2024, representing stability with no change from the previous year. While the number of new listings remained consistent, the overall increase in active listings suggests a potential accumulation of properties awaiting buyer interest and engagement.
Months Supply Inventory:
The months’ supply of inventory stood at 2.4, marking a significant uptick of 500.0% from the prior year. This substantial increase underscores a shifting market dynamic, with the supply of available homes, although still scarce, meeting more of the demand from prospective buyers, providing them with greater leverage in their purchasing decisions.
Closed Sales:
April 2024 recorded no closed sales, indicating a decline of 100.0% compared to the same period last year. This absence of closed transactions may reflect a temporary lull in buyer activity or a shift in market conditions, potentially influenced by external factors such as economic trends or seasonal fluctuations.
Average Days on Market:
The average days on market surged to 22 days, reflecting a notable increase of 175.0% from the previous year, calculated using a rolling 3-month average. This extended timeframe suggests a slower pace of property sales, with homes remaining on the market for a longer duration before securing suitable buyers.
List to Sold Price %:
The list to sold price percentage rose to 103.7%, indicating a modest increase of 5.3% from the prior year, calculated using a rolling 3-month average. This uptick suggests a slight strengthening of sellers’ negotiating power, with properties achieving closer to their listing prices during the sales process.
Average Sales Price:
The average sales price for residential properties in Sky Country settled at $753,750 in April 2024, representing a modest decrease of 3.7% from the previous year, calculated using a rolling 3-month average. This slight dip in average sales price reflects fluctuations in market conditions or changes in buyer preferences within the neighborhood.
Average Price per Square Foot:
The average price per square foot remained relatively stable at $427, showing a marginal decrease of 0.5% from the prior year, calculated using a rolling 3-month average. This subtle decline suggests a maintained level of value per square foot, indicating a consistent pricing trend within the Sky Country residential area.
Conclusion:
April 2024 witnessed a dynamic real estate market in Sky Country, characterized by increased inventory, subdued buyer activity, and stable pricing trends. As we navigate these evolving market dynamics, this residential market remains an attractive destination for both buyers and sellers, offering diverse housing options and opportunities.
Note: The above data is not intended to be a comparative market analysis for any one particular home. The above data provides an average valuation for homes sold in this area for the specified period.
Area 4: Mira Loma – South (original)
(Western portion of Jurupa Valley 91752)
End of Month Active Listings: 1 , no data re change from last year.
New Listings: 0 , 0.0% change from a year ago
Months Supply Inventory: 0.7 , no data re change from last year.
Closed Sales: 0 , -100.0% change from a year ago.
Average Days on Market: no data due to no closed sales.
List to Sold Price %: no data due to no closed sales.
Average Sales Price: $601,667 , -17.5% change from last year, calculated using a rolling 12-month average,
Average Price Square Foot: $453, +5.3% change from last year, calculated using a rolling 12-month average.
As we conclude the month of April 2024, the residential real estate market in the original Mira Loma-South area presents a unique landscape characterized by specific trends and metrics. Let’s examine the key insights that define the market dynamics for this period.
Active Listings:
At the end of April 2024, the Mira Loma-South neighborhood had 1 active listing, with no available data regarding changes from the previous year. While the number of active listings remains limited, the lack of available properties underscores ongoing scarcity of homes for prospective buyers seeking homes within this area.
New Listings:
No new listings were introduced to the market in April 2024, reflecting a static condition with no change from the previous year. This lack of new listings suggests a scarcity of inventory.
Months Supply Inventory:
The months’ supply of inventory stood at 0.7, with no available data regarding changes from the previous year. This metric indicates a relatively tight inventory level, with the supply of available homes meeting a minute portion of the demand from prospective buyers, influencing market dynamics and pricing trends.
Closed Sales:
April 2024 recorded no closed sales, representing a decline of 100.0% compared to the same period last year. The absence of closed transactions reflects tight market conditions within the Mira Loma-South residential area.
Average Days on Market:
Due to the absence of closed sales, data regarding the average days on the market is unavailable for April 2024. The lack of closed transactions precludes an assessment of the typical timeframe for properties to sell within our community during this reporting period.
List to Sold Price %:
Similarly, the absence of closed sales renders data regarding the list to sold price percentage unavailable for April 2024. Without closed transactions to analyze, it is not possible to ascertain the degree to which properties are selling relative to their listing prices within the Mira Loma-South neighborhood.
Average Sales Price:
The average sales price for residential properties in Mira Loma-South stood at $601,667 in April 2024, reflecting a decrease of 17.5% compared to the previous year. This figure, calculated using a rolling 12-month average, suggests a slight decline in average sales prices over the preceding year, potentially influenced by market dynamics and buyer preferences.
Average Price per Square Foot:
The average price per square foot increased to $453 in April 2024, marking a rise of 5.3% from the previous year, calculated using a rolling 12-month average. This upward trend in price per square foot suggests a maintained level of value and appreciation for residential properties within the Mira Loma-South neighborhood, despite fluctuations in average sales prices.
Summary:
April 2024 portrayed a distinct residential real estate market in the original Mira Loma-South area, characterized by limited inventory, a lack of closed sales, and fluctuations in average sales prices and price per square foot. As we navigate these evolving market dynamics, the area remains an attractive destination for prospective buyers.
Note: The above data is not intended to be a comparative market analysis for any one particular home. The above data provides an average valuation for homes sold in this area for the specified period.
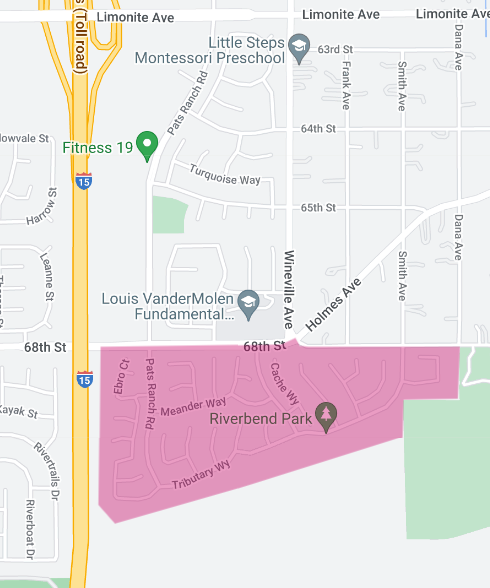
Area 5: River Bend Homes
(Western Edge of Jurupa Valley 91752)
End of Month Active Listings: 6 , +200.0% change from last year.
New Listings: 6 , no change from last year data.
Months Supply Inventory: 2.7, +145.5% change from last year
Closed Sales: 3, +50.0% change from last year
Average Days on Market: 28 , +3.7% change from last year
List to Sold Price %: 100.1%, -2.8% change from last year
Average Sales Price: $829,333 , +19.8% change from last year,
Average Price Square Foot: $334, -9.5% change from last year,
As we analyze the residential real estate market in the River Bend area for the month ending April 2024, we observe notable shifts and trends. Let’s examine the key metrics that have shaped the market dynamics during this period.
Active Listings:
At the close of April 2024, the River Bend neighborhood boasted a total of 6 active listings, marking a substantial increase of 200.0% compared to the same period last year. This surge in active listings indicates a greater availability of properties on the market, providing prospective buyers with increased options and opportunities for homeownership in the River Bend area.
New Listings:
Six new listings were introduced to the market in April 2024, maintaining consistency with no change from the data recorded the previous year. This stability in new listings suggests a sustained level of activity in the River Bend real estate market, with properties continually entering the market to meet ongoing demand.
Months Supply Inventory:
The months’ supply of inventory stood at 2.7, reflecting a significant increase of 145.5% compared to the previous year. This uptick in inventory levels indicates a more balanced market dynamic, with the supply of available homes meeting the demand from prospective buyers, potentially offering more favorable conditions for purchasers.
Closed Sales:
April 2024 witnessed three closed sales, marking a notable increase of 50.0% from the same period last year. This rise in closed transactions underscores the continued robust activity within the River Bend market, fueled by strong buyer demand and favorable market conditions conducive to successful property sales.
Average Days on Market:
The average days on market settled at 28 days, showing a modest increase of 3.7% compared to the previous year. This slight uptick suggests a marginally longer timeframe for properties to attract suitable buyers, potentially influenced by evolving market conditions and buyer preferences within the River Bend neighborhood.
List to Sold Price %:
The list to sold price percentage stood at 100.1%, reflecting a modest decrease of 2.8% from the previous year. While properties continue to sell close to their listing prices, this slight decline suggests a slight softening in seller negotiating power, potentially influenced by market dynamics and buyer behavior.
Average Sales Price:
The average sales price for residential properties in River Bend reached $829,333 in April 2024, demonstrating a substantial increase of 19.8% compared to the same period last year. This significant uptick in average sales price reflects robust appreciation in property values within this community, offering favorable returns for homeowners.
Average Price per Square Foot:
The average price per square foot decreased to $334, showing a modest decline of 9.5% from the previous year. Despite this decrease, the price per square foot remains at a relatively healthy level, indicating continued value in River Bend properties despite fluctuations in market conditions.
Summary:
April 2024 showcased a dynamic residential real estate market in the River Bend area, characterized by increased inventory, heightened buyer activity, and significant appreciation in property values. As we navigate these evolving market dynamics, this community remains an attractive destination for discerning buyers and investors, offering diverse housing options and opportunities for investment.
Note: The above data is not intended to be a comparative market analysis for any one particular home. The above data provides an average valuation for homes sold in this area for the specified period.
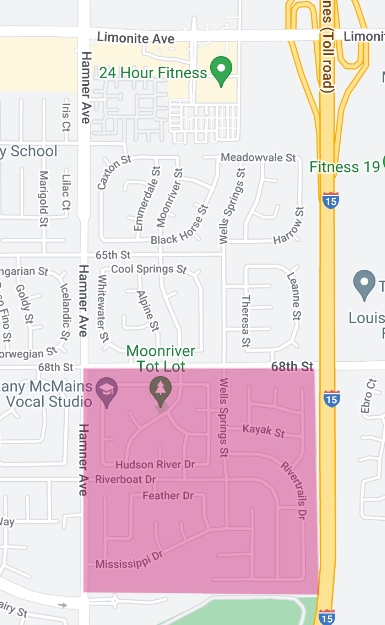
Area 6: Riverboat Dr. Area Homes
(Western Edge of 91752 ZIP Code, Eastvale, CA)
End of Month Active Listings: 0, -100.0% change from last year.
New Listings: 0, 0.0% change from last year.
Months Supply Inventory: no inventory
Closed Sales: 2, +100.3% change from last year.
Average Days on Market: 40, -76.6 change from last year.
List to Sold Price %: 105.0% , +13.0% change from last year.
Average Sales Price: $1,017,500, +26.8% change from a year ago, calculated using a rolling 3-month average.
Average Price Square Foot: $274, -3.5% change from last year, calculated using a rolling 3-month average.
As we conclude the month of April 2024, the residential real estate market adjacent to Riverboat Dr. presents a distinct market characterized by notable trends and shifts. Let’s delve into the key metrics that define the market dynamics for this period.
Active Listings:
At the end of April 2024, there were no active listings in the residential area adjacent to Riverboat Dr., representing a significant decrease of 100.0% compared to the same period last year. This absence of active listings underscores a heightened demand for properties within this sought-after neighborhood, leading to competitive market conditions for prospective buyers.
New Listings:
Similarly, there were no new listings introduced to the market in April 2024, maintaining consistency with no change from the data recorded the previous year. This lack of new listings suggests scarce inventory within the residential area adjacent to Riverboat Dr., with properties being sold as they are listed.
Months Supply Inventory:
Data regarding the months’ supply of inventory is unavailable for this reporting period, indicating a lack of inventory data to assess the balance between supply and demand within the residential area adjacent to Riverboat Dr.
Closed Sales:
April 2024 witnessed two closed sales, marking a notable increase of 100.3% compared to the same period last year. This rise in closed transactions highlights the sustained activity and demand for properties within the neighborhood, driven by factors such as desirable location, amenities, and overall market conditions.
Average Days on Market:
The average days on market decreased to 40 days, reflecting a significant decline of 76.6% from the previous year. This notable decrease suggests a faster turnaround time for properties to attract suitable buyers, indicating heightened buyer interest and competitive market conditions within the residential area adjacent to Riverboat Dr.
List to Sold Price %:
The list to sold price percentage reached 105.0%, showing a notable increase of 13.0% from the previous year. This upward trend indicates sellers’ ability to secure prices exceeding their listing amounts, attributed to strong demand and favorable market conditions within the neighborhood.
Average Sales Price:
The average sales price for residential properties in the area adjacent to Riverboat Dr. stood at $1,017,500 in April 2024, calculated using a rolling 3-month average, demonstrating a substantial increase of 26.8% compared to the same period last year. This significant uptick in average sales price reflects robust appreciation in property values, highlighting the desirability and value proposition of homes within the neighborhood.
Average Price per Square Foot:
The average price per square foot decreased to $274, showing a modest decline of 3.5% from the previous year, calculated using a rolling 3-month average. Despite this decrease, the price per square foot remains relatively strong, indicating continued value in properties within the residential area adjacent to Riverboat Dr.
Conclusion:
April 2024 illustrates a vibrant residential real estate market, characterized by limited inventory, increased closed sales, and significant appreciation in property values. As we navigate these evolving market dynamics, the neighborhood remains an attractive destination for discerning buyers, offering desirable homes and investment opportunities in this Eastvale neighborhood.
Note: The above data is not intended to be a comparative market analysis for any one particular home. The above data provides an average valuation for homes sold in this area for the specified period.
Area 7: Country Springs/ Cimmaron Ranch
(Western Edge of 91752 ZIP Code, Eastvale, CA)
End of Month Active Listings: 3, +200.0% change from a year ago.
New Listings: 3, no data re change from a year ago.
Months Supply Inventory: 2.6, +333.3% change from a year ago.
Closed Sales: 2 , no data re change from a year ago.
Average Days on Market: 6, no data re change from a year ago.
List to Sold Price %: 100.0% , no data re change from a year ago.
Average Sales Price: $827,500, no data re change from a year ago.
Average Price Square Foot: $290, no data re change from a year ago.
As we assess the residential real estate market in the Country Springs-Cimmaron Ranch area for the month ending April 2024, we observe a residential market characterized by stability and notable metrics. Let’s delve into the key insights that define the market dynamics for this period.
Active Listings:
At the close of April 2024, the Country Springs-Cimmaron Ranch neighborhood had 3 active listings, marking a significant increase of 200.0% compared to the same period last year. This rise in active listings indicates a greater availability of properties on the market, potentially providing buyers with increased options and opportunities for homeownership within this community.
New Listings:
Three new listings were introduced to the market in April 2024, maintaining consistency. This stability in new listings suggests a sustained level of activity in the Country Springs-Cimmaron Ranch real estate market, with properties continually being listed for sale to meet ongoing demand.
Months Supply Inventory:
The months’ supply of inventory stood at 2.6, reflecting a significant increase of 333.3% compared to the previous year. This uptick in inventory levels indicates a more balanced market dynamic, with the supply of available homes meeting demand from prospective buyers, potentially offering favorable conditions for purchasers.
Closed Sales:
There were two closed sales in April 2024. While specific percentage changes are not available, the presence of closed transactions suggests continued activity and demand within the Country Springs-Cimmaron Ranch market,driven by various factors such as desirable location, amenities, and overall market conditions.
Average Days on Market:
The average days on market settled at 6 days, with no available data regarding changes from the previous year. This figure indicates a swift turnaround time for properties to attract suitable buyers, reflecting heightened buyer interest and competitive market conditions within the Country Springs-Cimmaron Ranch neighborhood.
List to Sold Price %:
The list to sold price percentage remained at 100.0%, with no available data regarding changes from the previous year. While specific percentage changes are not provided, this figure suggests that properties within the neighborhood continue to sell close to their listing prices, indicating stability in seller negotiating power and market conditions.
Average Sales Price:
The average sales price for residential properties in Country Springs-Cimmaron Ranch stood at $827,500 in April 2024. While specific percentage changes are not available, this figure reflects the prevailing price level within the neighborhood, influenced by market dynamics and buyer preferences.
Average Price per Square Foot:
The average price per square foot settled at $290. While specific percentage changes are not provided, this figure reflects the value proposition of properties within the Country Springs-Cimmaron Ranch area, influenced by factors such as property size, condition, and location.
Conclusion:
April 2024 portrayed a stable and active residential real estate market in the Country Springs-Cimmaron Ranch area, characterized by increased inventory, closed sales, and consistent market metrics. As we navigate these market dynamics, the community remains an attractive destination for discerning buyers and investors, offering desirable homes and opportunities for homeownership.
Note: The above data is not intended to be a comparative market analysis for any one particular home. The above data provides an average valuation for homes sold in this area for the specified period.
Area 8: Stratford Township Homes
(Western Edge of Jurupa Valley 91752)
End of Month Active Listings: 2, no data re change from a year ago.
New Listings: 0, -100.0% change from last year.
Months Supply Inventory: 1.7 , no data re change from a year ago.
Closed Sales: 0, 0.0% change from last year.
Average Days on Market: no data.
List to Sold Price %: 97.6%, -2.2% change from last year, calculated using a rolling 3-month average.
Average Sales Price: $1,025,000, +36.7% change from last year, calculated using a rolling 3-month average.
Average Price Square Foot: $218 , -26.8% change from last year, calculated using a rolling 3-month average.
As we assess the residential real estate market in the Stratford Township area for the month ending April 2024, we observe a nuanced landscape characterized by specific trends and metrics. Let’s delve into the key insights that define the market dynamics for this period.
Active Listings:
At the end of April 2024, there were 2 active listings in the Stratford Township residential area, with no available data regarding changes from the previous year. This indicates a consistent level of available properties on the market, potentially meeting ongoing demand from prospective buyers within this community.
New Listings:
No new listings were introduced to the market in April 2024, marking a notable decrease of 100.0% compared to the same period last year. This decline in new listings illustrates the scarcity in market activity influencing inventory levels and buyer options.
Months Supply Inventory:
The months’ supply of inventory stood at 1.7, with no available data regarding changes from the previous year. This figure indicates a relatively balanced market dynamic, with the supply of available homes meeting a portion of the demand from prospective buyers, potentially influencing market conditions and pricing trends.
Closed Sales:
April 2024 recorded no closed sales, reflecting a sort of consistency with no change from the previous year. While specific percentage changes are not provided, the absence of closed transactions suggests a temporary lull in buyer activity or a shift in market conditions within the Stratford Township residential area.
Average Days on Market:
Since there were no closed sales, data regarding the average days on market is unavailable for April 2024, preventing an assessment of the typical timeframe for properties to sell within the Stratford Township area during this reporting period.
List to Sold Price %:
The list to sold price percentage settled at 97.6%, showing a modest decrease of 2.2% from the previous year, calculated using a rolling 3-month average. This slight decline suggests a softening in seller negotiating power, potentially influenced by market dynamics and buyer behavior within the Stratford Township residential market.
Average Sales Price:
The average sales price for residential properties in Stratford Township reached $1,025,000 in April 2024, demonstrating a significant increase of 36.7% compared to the same period last year, calculated using a rolling 3-month average. This substantial uptick in average sales price reflects robust appreciation in property values within this community, driven by various factors such as location desirability, amenities, and overall market conditions.
Average Price per Square Foot:
The average price per square foot decreased to $218, showing a notable decline of 26.8% from the previous year, calculated using a rolling 3-month average. Despite this decrease, the price per square foot remains at a relatively healthy level, indicating continued value in properties within the Stratford Township residential area despite fluctuations in market conditions.
In summary, April 2024 portrayed a nuanced residential real estate market in the Stratford Township area, characterized by consistent inventory levels, limited new listings, and notable changes in average sales price and price per square foot. As we navigate these evolving market dynamics, this community remains an attractive destination for discerning buyers and investors, offering diverse housing options and opportunities for investment.
Note: The above data is not intended to be a comparative market analysis for any one particular home. The above data provides an average valuation for homes sold in this area for the specified period.
AREA 9: Eastvale Estates (Bellegrave Ave./Hamner Ave/)
(Western Edge of 91752 ZIP Code, Eastvale, CA)
End of Month Active Listings: 2, no change data from a year ago.
New Listings: 1 , 0.0% change from a year ago.
Months Supply Inventory: 2.0, no change data from a year ago.
Closed Sales: 0, 0.0% change from a year ago.
Average Days on Market: No Data.
List to Sold Price %: No Data.
Average Sales Price: $795,333, -3.0% change from last year, calculated using a rolling 12-month average.
Average Price Square Foot: $310, -26.5% change from last year, calculated using a rolling 12-month average.
As we evaluate the residential real estate market in the Eastvale Estates area for the month ending April 2024, we observe a market characterized by stability and notable metrics. Let’s delve into the key insights that define the market dynamics for this period.
Active Listings:
At the close of April 2024, there were 2 active listings in the Eastvale Estates residential area, with no change in data compared to the same period last year. This indicates a consistent level of available properties on the market, potentially meeting ongoing demand from prospective buyers within this community.
New Listings:
One new listing was introduced to the market in April 2024, maintaining stability with no change from the data recorded the previous year. This consistency in new listings suggests a balanced level of inventory turnover within the Eastvale Estates real estate market, with properties being listed for sale at a steady pace over time.
Months Supply Inventory:
The months’ supply of inventory stood at 2.0, with no change in data compared to the previous year. This figure indicates a relatively balanced market dynamic, with the supply of available homes meeting a portion of the demand from prospective buyers, potentially influencing market conditions and pricing trends.
Closed Sales:
April 2024 recorded no closed sales. While specific percentage changes from a year ago are not available, the absence of closed transactions suggests a stability in buyer and seller activity within the Eastvale Estates residential area.
Average Days on Market:
Since there were no closed sales, data regarding the average days on market is unavailable for April 2024, preventing an assessment of the typical timeframe for properties to sell within the Eastvale Estates area during this reporting period.
List to Sold Price %:
Since there were no closed sales, data regarding the list to sold price percentage is unavailable for April 2024, precluding an analysis of the relationship between listing prices and actual sale prices within the Eastvale Estates market.
Average Sales Price:
The average sales price for residential properties in Eastvale Estates settled at $795,333 in April 2024, calculated using a rolling 12-month average. This reflects a modest decrease of 3.0% compared to the same period last year. This slight decline in average sales price may reflect fluctuations in market conditions or changes in buyer preferences within the Eastvale Estates neighborhood.
Average Price per Square Foot:
The average price per square foot decreased to $310 in April 2024, calculated using a rolling 12-month average. This shows a notable decline of 26.5% from the previous year. Despite this decrease, the price per square foot remains relatively stable, indicating continued value in properties within the Eastvale Estates residential area despite fluctuations in market conditions.
In summary, April 2024 portrayed a stable and steady residential real estate market in the Eastvale Estates area, characterized by consistent inventory levels, limited new listings, and notable changes in average sales price and price per square foot. As we navigate these market dynamics, this community remains an attractive destination for discerning buyers and investors, offering desirable homes and opportunities for homeownership.
Note: The above data is not intended to be a comparative market analysis for any one particular home. The above data provides an average valuation for homes sold in this area for the specified period.
Area 10: Harvest Villages at Vernola Ranch
(Western Edge of Jurupa Valley 91752)
End of Month Active Listings: 3, +200.0% change from last year.
New Listings: 1 , no change data from last year.
Months Supply Inventory: 2.1 , +133.3% change from last year.
Closed Sales: 0, 0.0% change from last year.
Average Days on Market: no data due to no closed sales.
List to Sold Price %: 96.0%, +0.1% change from last year, calculated using a rolling 6-month average.
Average Sales Price: $837,500 , +0.7% change from last year, calculated using a rolling 6-month average.
Average Price Square Foot: $272 , +1.1% change from last year, calculated using a rolling 6-month average.
As we conclude the month of April 2024, the residential real estate market in the Harvest Villages area presents a nuanced landscape characterized by specific trends and metrics. Let’s delve into the key insights that define the market dynamics for this period.
Active Listings:
At the end of April 2024, Harvest Villages had 3 active listings, marking a substantial increase of 200.0% compared to the same period last year. This surge in active listings indicates a greater availability of properties on the market, potentially providing prospective buyers with increased options and opportunities for homeownership within this community.
New Listings:
One new listing was introduced to the market in April 2024, maintaining consistency with no change from the data recorded the previous year. This stability in new listings suggests a sustained level of activity in the Harvest Villages real estate market, with properties continually entering the market to meet ongoing demand.
Months Supply Inventory:
The months’ supply of inventory stood at 2.1, reflecting a significant increase of 133.3% compared to the previous year. This uptick in inventory levels indicates a more balanced market dynamic, with the supply of available homes meeting demand from prospective buyers, potentially offering favorable conditions for purchasers.
Closed Sales:
April 2024 recorded no closed sales, reflecting consistency with no change from the same period last year. While specific percentage changes are not provided, the absence of closed transactions suggests stability in buyer and seller activity within the Harvest Villages residential area.
Average Days on Market:
Data regarding the average days on market is unavailable for April 2024 due to the absence of closed sales. Without closed transactions to analyze, it is not possible to ascertain the typical timeframe for properties to sell within the Harvest Villages area during this reporting period.
List to Sold Price %:
The list to sold price percentage settled at 96.0%, showing a slight increase of 0.1% from the previous year, calculated using a rolling 6-month average. This marginal uptick suggests a maintained level of seller negotiating power, with properties selling close to their listing prices within the Harvest Villages market.
Average Sales Price:
The average sales price for residential properties in Harvest Villages reached $837,500 in April 2024, calculated using a rolling 6-month average. This demonstrates a modest increase of 0.7% compared to the same period last year. This slight uptick in average sales price reflects stability and potentially gradual appreciation in property values within this community.
Average Price per Square Foot:
The average price per square foot increased to $272 in April 2024, calculated using a rolling 6-month average. This shows a slight rise of 1.1% from the previous year. Despite this increase, the price per square foot remains at a relatively competitive level, indicating continued value in properties within the Harvest Villages residential area.
In summary, April 2024 portrayed a stable and active residential real estate market in the Harvest Villages area, characterized by increased inventory, limited new listings, and consistent market metrics. As we navigate these evolving market dynamics, this community remains an attractive destination for discerning buyers and investors.
Note: The above data is not intended to be a comparative market analysis for any one particular home. The above data provides an average valuation for homes sold in this area for the specified period.
Area 11: Mira Loma Village,
(North-Western portion of Jurupa Valley 91752)
End of Month Active Listings: 0, 0.0% change from last year.
New Listings: 0, 0.0% change from last year.
Months Supply Inventory: no inventory.
Closed Sales: 0, 0.0% change from last year.
Average Days on Market: No Data due to no closed sales.
List to Sold Price %: No Data due to no closed sales.
Average Sales Price: $597,500 , calculated using a rolling 12-month average, +81.1% change from last year.
Average Price Square Foot: $453, calculated using a rolling 12-month average, +41.6% change from last year.
Since January 1, 2023, 2 houses were sold, one in February 2023 listed for $610,000 and sold for $615,000. The second house sold in August 2023, listed for $525,000 and sold for $580,000.
As we assess the residential real estate market in the Mira Loma Village area for the month ending April 2024, we encounter a dormant real estate market. Although certain data points are unavailable, the available metrics provide valuable insights into the market dynamics of this community.
Active Listings and New Listings:
April 2024 witnessed no active listings or new listings, maintaining consistency with no change from the previous year. This stable community has seen no turnover.
Months Supply Inventory:
Since there is no listing inventory, data regarding months’ supply of inventory is unavailable for April 2024, preventing an assessment of the balance between supply and demand within the Mira Loma Village market during this reporting period.
Closed Sales, Average Days on Market, and List to Sold Price %:
April 2024 recorded no closed sales, with no available data regarding average days on market or list to sold price percentage due to the absence of closed transactions. This limits our ability to gauge market performance and seller negotiating power within the Mira Loma Village area for this period.
Average Sales Price and Average Price per Square Foot:
The average sales price for residential properties in Mira Loma Village remains elusive for April 2024.
Historical Market Sales Data:
Since January 1, 2023, two houses were sold in the Mira Loma Village area, showcasing the diverse range of prices and transactions within our community. The first sale occurred in February 2023, with a property listed for $610,000 and sold for $615,000. The second sale took place in August 2023, with a property listed for $525,000 and sold for $580,000.
Note: The above data is not intended to be a comparative market analysis for any one particular home. The above data provides an average valuation for homes sold in this area for the specified period.
Area 12: Homestead,
(North-Western portion of Jurupa Valley 91752)
End of Month Active Listings: 1, no change from last year data.
New Listings: 1, 0.0% change from last year.
Months Supply Inventory: 0.5, no change from last year data.
Closed Sales: 2 , 0.0% change from last year.
Average Days on Market: 6, -88.2% change from last year.
List to Sold Price %: 101.4% , +1.9% change from last year.
Average Sales Price: $587,500 , +9.9% change from last year.
Average Price Square Foot: $463, -3.3% change from last year.
As we reflect on the residential real estate market in the Homestead area for the month ending April 2024, we observe a real estate landscape characterized by stability and notable trends. Let’s explore the key metrics that define the market dynamics for this period.
Active Listings and New Listings:
At the end of April 2024, the Homestead residential area had 1 active listing, maintaining consistency with no change from the data recorded the previous year. Additionally, one new listing was introduced to the market, showing stability with a 0.0% change from the same period last year. These metrics indicate a steady level of inventory turnover within the Homestead market, with properties continually being listed to meet ongoing demand.
Months Supply Inventory:
The months’ supply of inventory remained at 0.5, showing no change from the previous year. This figure signifies a balanced market dynamic, with the supply of available homes meeting a portion of the demand from prospective buyers within the Homestead area.
Closed Sales:
April 2024 witnessed 2 closed sales in the Homestead residential area, reflecting consistency with no change from the same period last year. This stability in closed transactions indicates sustained buyer activity and market engagement within this community.
Average Days on Market:
The average days on market settled at 6 days, marking a significant decrease of 88.2% compared to the previous year. This swift turnaround time for properties to sell suggests heightened buyer interest and competitive market conditions within the Homestead area, potentially driven by factors such as location desirability and property quality.
List to Sold Price %:
The list to sold price percentage reached 101.4%, showing a modest increase of 1.9% from the previous year. This uptick suggests that properties within the Homestead market continue to sell close to their listing prices, indicating stability in seller negotiating power and market conditions.
Average Sales Price and Average Price per Square Foot:
The average sales price for residential properties in Homestead reached $587,500 in April 2024, demonstrating a notable increase of 9.9% compared to the same period last year. Similarly, the average price per square foot decreased to $463, showing a modest decline of 3.3% from the previous year. These metrics highlight the appreciation in property values within this community while maintaining affordability and value for prospective buyers.
In summary, April 2024 portrayed a stable and active residential real estate market in the Homestead area, characterized by consistent inventory levels, closed sales, and notable changes in pricing metrics. As we navigate these market dynamics, this community remains an attractive destination for discerning buyers and investors.
Note: The above data is not intended to be a comparative market analysis for any one particular home. The above data provides an average valuation for homes sold in this area for the specified period.
******
As a real estate broker, understanding the above-nuanced market shifts is key to providing informed advice and strategy to sellers throughout the 91752 zip code area.
Contact me to understand how the above trends can impact your real estate decisions. I provide expert guidance and strategic insights and can guide you through these interesting times in real estate.
Manny Barba
Broker-Attorney-Realtor®
951-990-3998
MB Live Realty, Inc.
Note: All data in this report is from California Regional Multiple Listing Service (CRMLS) All information should be independently reviewed and verified for accuracy. This report is for informational purposes only and not intended as financial or investment advice.

No Comments