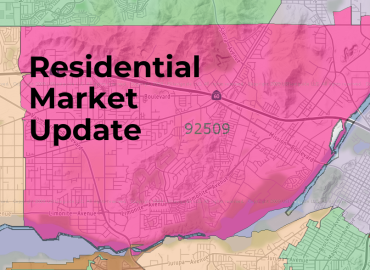
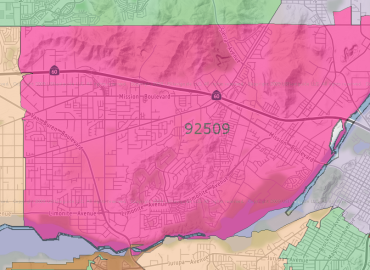
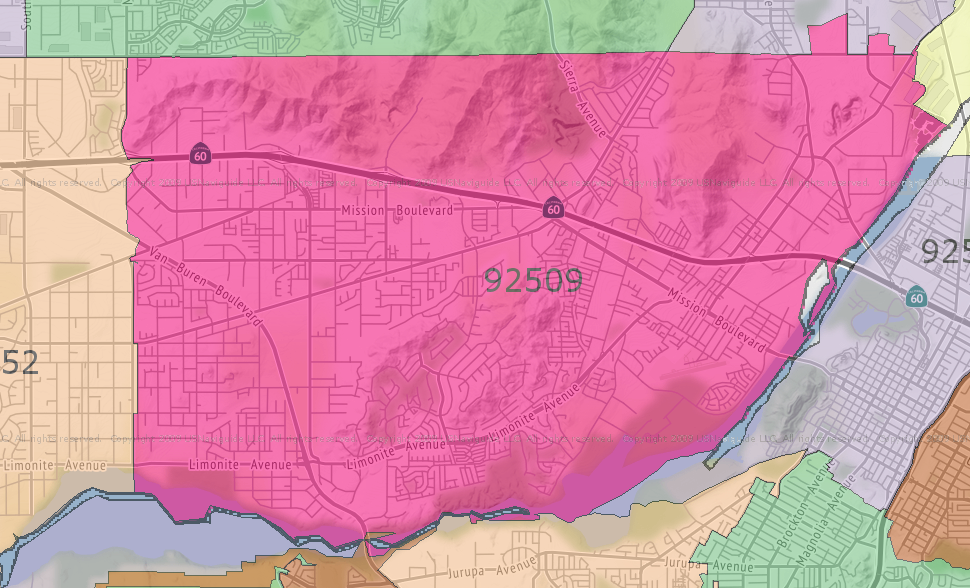
92509 Residential Real Estate Market Update – Jurupa Valley – March 2024
History of the 92509
The 92509 ZIP code area, primarily associated with City of Jurupa Valley in Riverside County, California, has a rich history that intertwines with the broader development of Southern California.
Initially, the area was inhabited by the Gabrielino and Serrano Tribes. Later, in 1838, the Mexican government granted Rancho Jurupa to Juan Bandini, a prominent Californio entrepreneur, marking the beginning of non-Native settlement. The name “Jurupa” was used as early as 1887 and is derived from a previous rancho operated by the Mission San Gabriel Arcángel, which was disbanded in 1833. The exact meaning of “Jurupa” is debated, with some suggesting it means “watering place” or refers to a local plant, the Artemisia californica.
Efforts to incorporate the city began in 1992, with voters initially rejecting the proposal. However, on March 8, 2011, a successful vote led to the incorporation of Jurupa Valley, effective July 1, 2011. This new city included several communities like Mira Loma, Glen Avon, and Rubidoux. Jurupa Valley faced financial challenges early on, nearly leading to disincorporation, but these were eventually resolved with state legislative action.
As for demographics, the 2010 U.S. Census reported that Glen Avon, a part of the 92509 area, had a diverse population with a significant Hispanic/ Latino presence. The area has evolved over time, reflecting broader demographic and economic trends in Southern California.
Jurupa Valley’s governance includes a city council and a mayor, with representation at the state and federal levels aligning with California’s legislative districts. The area is served by the Jurupa Unified School District, providing educational services through various schools.
The history of the 92509 ZIP code area is a microcosm of the broader historical, cultural, and political developments of Southern California, marked by its early Native American presence, ranching origins, and evolving community identity in the modern era.
The data that follows is not intended to be a comparative market analysis for any one particular home, but instead gives a general valuation for homes in each of the 12 specified areas, and in whole the entire residential areas located in the 92509-zip code.
For a detailed and personalized market analysis of your home, or if you have any questions, feel free to contact me.
Manny Barba,
Broker-Attorney-Realtor®
DRE #00879806
951-990-3998
mail@mbliverealty.com
MB Live Realty, Inc.
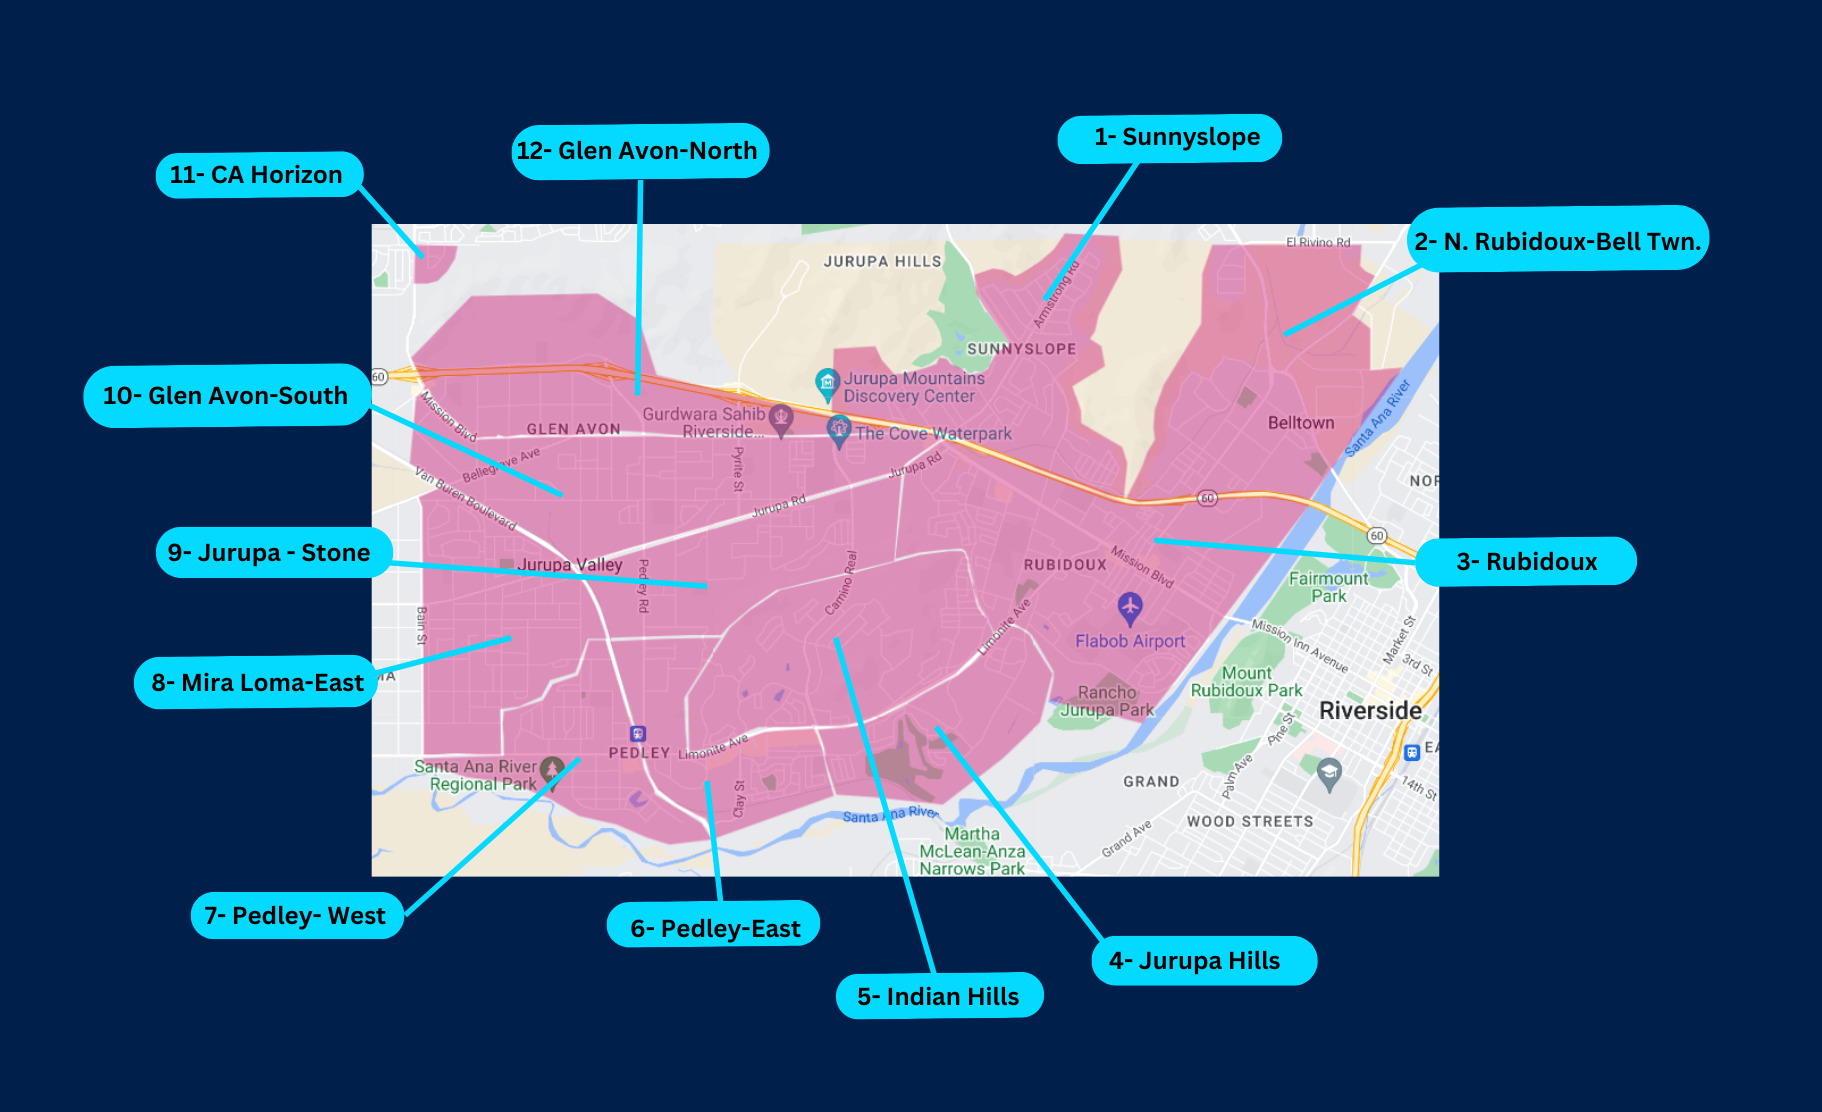
AREA 1:
Sunnyslope,
Jurupa Valley, CA 92509
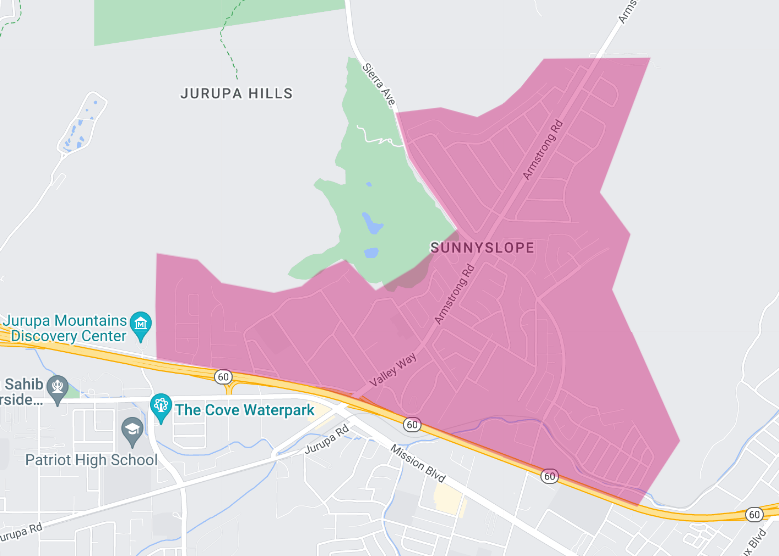
Here is the residential market update for the Sunnyslope area for the month ending March 2024. This report synthesizes crucial market metrics and trends, offering a comprehensive snapshot of the current real estate landscape in our vibrant community.
The month concluded with a total of 5 active listings, marking a significant decrease of 28.6% from the previous year. This reduction highlights a tightening market where available properties have become scarcer, potentially increasing competition among buyers. Despite this notable decrease in inventory, the number of new listings remained steady, with 3 properties introduced to the market, mirroring the figure from the same period last year. This stability in new listings suggests a consistent level of homeowner interest in selling, despite the overall drop in active listings.
The months’ supply of inventory, an essential indicator of market balance, stood at 1.5 months. This represents an increase of 15.4% compared to last year, indicating a slight shift towards a more balanced market, albeit still favoring sellers. The scarcity of inventory relative to demand is underscored by the fact that the market remains competitive, though with a slight increase in available supply.
In terms of sales activity, the market experienced a downturn, with only 1 closed sale recorded for the month, a sharp 75% decline from the year prior. This reduction could reflect various factors, including the lower number of active listings and possibly more stringent lending conditions or buyer hesitancy.
Buyers and sellers reached agreements relatively quickly, as evidenced by the average days on market for sold properties, which dramatically decreased to 5 days, down from the previous year by 95.6%. This rapid turnover rate underscores the high demand for homes in Sunnyslope, with properties moving from listing to sale with remarkable speed.
Financially, the market remains robust. The list to sold price percentage, an indicator of how close homes are selling to their asking prices, stood at 97.7%, a slight improvement of 0.9% over last year. This figure suggests that buyers are willing to pay near asking prices, reflecting a competitive market environment.
The average sales price in Sunnyslope showed a healthy year-on-year growth of 8.7%, reaching $698,251. This growth, calculated on a rolling 3-month average, indicates a strong appreciation in property values, a positive sign for homeowners and investors alike. Similarly, the average price per square foot has seen a substantial increase of 19.2% from the previous year, standing at $423, further evidence of the area’s desirability and the overall health of the real estate market.
In summary, the Sunnyslope residential real estate market has experienced some tightening, with a notable decrease in active listings but stable new entries. Despite a significant drop in closed sales, the rapid pace of transactions and the appreciating property values reflect a highly competitive environment. As we move forward, these dynamics underscore the importance of strategic planning for buyers and sellers alike to navigate the market effectively.
Area 2:
North Rubidoux-Belltown
Jurupa Valley, CA 92509
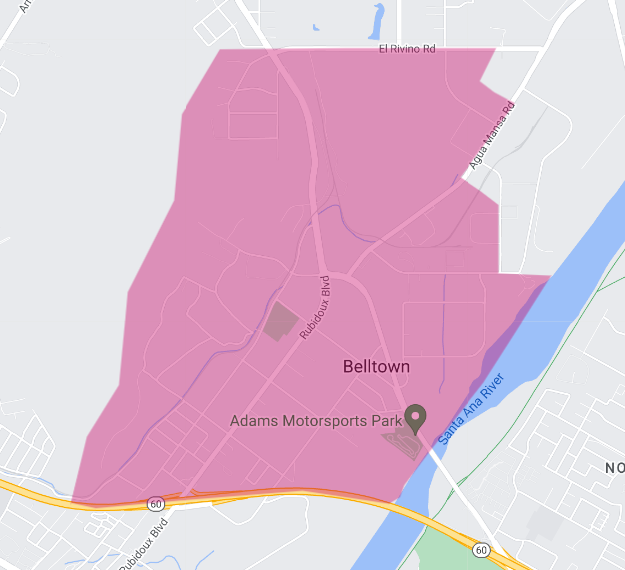
As of the close of March 2024, here is the latest market update for the North Rubidoux-Belltown residential area. This report aims to shed light on our community’s current real estate trends, providing insights that are crucial for both potential buyers and sellers in navigating the market effectively.
The North Rubidoux-Belltown area has significantly shifted its real estate dynamics over the past year. A notable highlight is the end-of-month active listings count, which stands at 4 properties. This figure represents a substantial increase, doubling from the same period last year. This increase in active listings suggests that homeowners are becoming more interested in selling, potentially due to the area’s appreciating property values.
However, the market has experienced a contraction in terms of new listings, with only 1 new property introduced this month. This represents a 50% decrease from the previous year, indicating a possible hesitancy among potential sellers to enter the market or a timing anomaly in listing patterns.
A critical metric to consider is the months’ supply of inventory, which has dramatically increased to 4.0 months. This is a significant rise of 263.6% from the previous year, indicating a shift towards a market that might be becoming more favorable to buyers. Such an increase in inventory supply suggests that buyers may find themselves with more options to choose from and potentially more negotiating power.
The area has faced a challenge in terms of sales activity, with no closed sales reported for the month. This starkly contrasts last year and underscores a slowdown in market transactions. The lack of closed sales also means that data on average days on market and list to sold price percentage is unavailable, leaving a gap in understanding how quickly homes might be selling and at what price relative to their listing price under different circumstances.
Financially, the North Rubidoux-Belltown area continues to show strength, with the average sales price reported at $500,000. This figure is based on a rolling 6-month average and marks an impressive 48.1% increase from the previous year. Similarly, the average price per square foot has risen to $456, representing a 46.6% increase from last year. These metrics indicate a significant appreciation in property values, which is a positive sign for homeowners and real estate investors.
In conclusion, the North Rubidoux-Belltown residential area is undergoing a period of transformation. With an increased number of active listings and a substantial rise in the months’ supply of inventory, the market dynamics are shifting. The absence of closed sales this month highlights a pause in transactional activity, which could be attributed to various factors including market conditions or seasonal trends. However, the strong growth in average sales price and price per square foot signals continued interest in the area and the potential for future market activity. As the market evolves, it remains essential for both buyers and sellers to stay informed and strategic in their real estate decisions.
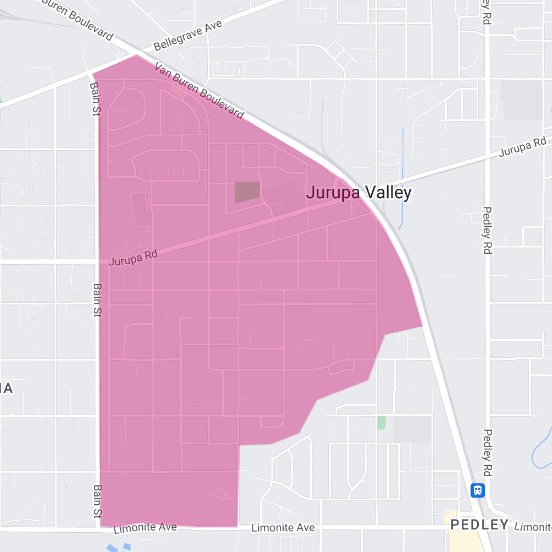
Area 3:
Rubidoux,
Jurupa Valley, CA 92509
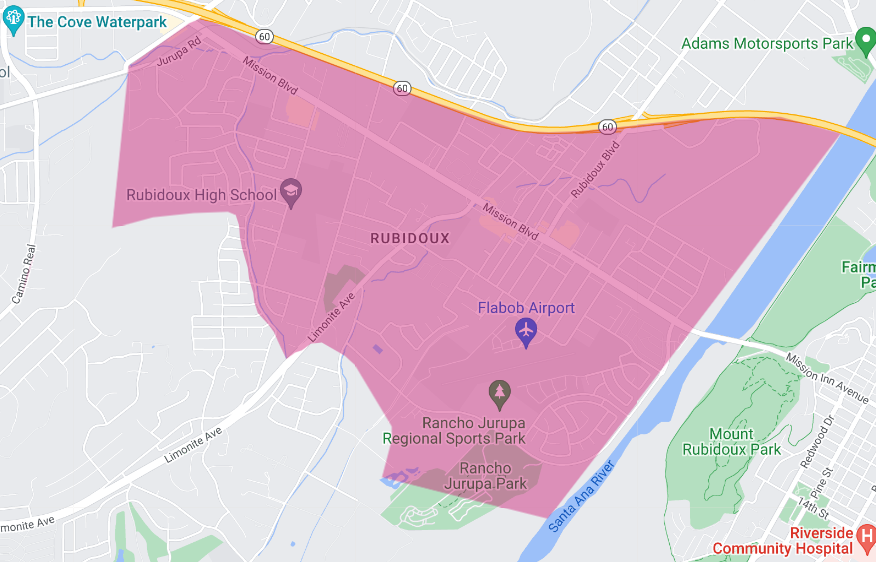
Here is an in-depth analysis of the Rubidoux residential real estate market as of the end of March 2024, detailing the current trends and shifts that have taken place over the past month. This report offers valuable insights for homeowners, buyers, and sellers alike, enabling informed decisions in a dynamic market landscape.
The Rubidoux area has experienced significant activity this month, with end-of-month active listings reaching 11 properties. This marks a 37.5% increase from the previous year, indicating a more vibrant market with a wider selection of homes for potential buyers. This uptick in listings reflects a growing confidence among sellers and an opportunity for buyers seeking to enter the market.
Notably, the number of new listings has seen a remarkable surge, doubling to 8 compared to the same period last year. This influx of new properties demonstrates a robust interest in selling within the community, contributing to the diversity and availability of housing options for prospective buyers.
The months’ supply of inventory, a crucial indicator of market balance, now stands at 2.2 months. This represents a significant increase of 69.2% from last year, suggesting a gradual shift towards a market that slightly favors buyers, yet remains competitive due to relatively low inventory levels.
Despite these positive trends in listings and inventory, closed sales have experienced a downturn, with 7 transactions completed, marking a 22.2% decrease from the previous year. This reduction in sales could be attributed to various factors, including market adjustments or possibly more discerning buyers.
The average days on market for sold properties dramatically decreased to 17 days, showcasing a swift transaction pace and a 71.2% reduction from last year. This rapid turnover indicates strong buyer demand and a competitive market environment, where well-priced and appealing homes move quickly.
Financially, the Rubidoux area continues to show promising signs of growth. The list to sold price percentage now averages 101.2%, a 3.2% increase from the previous year, suggesting that homes are not only selling close to their asking prices but often above. This trend points to a competitive bidding environment and a strong market position for sellers.
The average sales price in Rubidoux has seen an 18.0% increase from the previous year, reaching $612,854. This rise in property values reflects the area’s desirability and the overall health of the real estate market. However, the average price per square foot has decreased by 8.1% to $351, indicating a shift in the types of properties being sold or variations in market demand across different housing segments.
In summary, the Rubidoux residential real estate market has shown dynamic changes over the past month, with significant increases in active and new listings contributing to a more diverse market. While closed sales have decreased, the rapid sales pace and above-asking selling prices highlight a competitive environment. The appreciation in average sales price, coupled with the slight decrease in price per square foot, suggests nuanced market conditions that both buyers and sellers must navigate. As always, strategic planning and market awareness are key to leveraging opportunities in the Rubidoux area.
Area 4:
Jurupa Hills,
Jurupa Valley 92509
Here is a detailed report on the residential real estate market for the Jurupa Hills area, ending March 2024. This overview is designed to deliver key insights and trends, equipping our clients with the necessary information to make informed decisions in a rapidly evolving market landscape.
The Jurupa Hills residential area has shown remarkable activity this month, underscored by significant growth across several key market indicators. Starting with active listings, we observed a substantial increase to 3 properties, a 200% rise from the previous year. This growth indicates a more dynamic market, with homeowners increasingly inclined to list their properties, offering more options for prospective buyers.
In tandem with the rise in active listings, new listings have also seen a notable surge, doubling to 2. This increase reflects a growing interest among sellers to engage with the market, contributing to a broader range of housing options available to buyers.
One of the most striking developments has been the expansion of the months’ supply of inventory, which now stands at 1.5 months. This figure represents a substantial 275% increase from the previous year, indicating a slightly more balanced market. Despite this increase, the inventory level remains relatively low, maintaining a competitive environment for buyers.
Sales activity has also experienced a significant uptick, with closed sales rising to 4, marking a 300% increase from the previous year. This jump in sales activity is a positive indicator of robust demand and buyer confidence within the Jurupa Hills area.
The average days on market for properties has dramatically decreased to 19 days, a reduction of 79.6% from the previous year. This rapid pace of sales underscores the market’s high demand and competitive nature, with homes selling much faster than in the past.
Financial indicators also reveal a strong market performance. The list-to-sold price percentage has impressively climbed to 116.3%, an 18.8% increase from the previous year. This metric indicates that homes are not only selling at their asking price but often well above it, highlighting the competitive bidding environment in Jurupa Hills.
The average sales price in the area has grown to $525,000, reflecting a 7.2% increase from the previous year. This growth signifies a healthy appreciation in property values, signaling a robust investment opportunity for homeowners and investors alike.
However, the average price per square foot has slightly declined, down 4.7% to $404. This decrease may suggest variations in the types of properties being sold or a shift in buyer preferences, emphasizing the importance of understanding specific market segments.
In conclusion, the Jurupa Hills residential market has demonstrated significant vitality and growth over the past month. The market is highly competitive with increased active and new listings, a substantial rise in closed sales, and properties selling rapidly above asking price. The slight decrease in the price per square foot, juxtaposed with the overall increase in average sales price, presents nuanced opportunities and challenges. As always, navigating the Jurupa Hills real estate landscape requires strategic insight and a deep understanding of market trends, ensuring our clients can make the most informed decisions in their real estate endeavors.
Area 5:
Indian Hills
Jurupa Valley, CA 92509

Here is a detailed report on the residential real estate market for the Indian Hills residential area, ending March 2024. The report comprehensively examines the current trends and dynamics shaping our local real estate landscape. This analysis aims to provide our clients with the insights needed to navigate the market effectively, whether they are considering buying, selling, or staying informed on their investment’s state.
At the end of the month, the Indian Hills area experienced a notable decrease in the number of active listings, with just 6 properties available, marking a significant 40% decline from the previous year. This reduction in active listings suggests a tighter market, potentially leading to increased buyer competition for the limited inventory available.
Conversely, the area has seen a positive trend in new listings, with 4 new properties entering the market, reflecting a 33.3% increase compared to last year. This rise indicates a growing willingness among homeowners to sell, contributing to a slightly more diverse pool of options for prospective buyers, despite the overall lower inventory levels.
The months’ supply of inventory has seen a slight uptick, standing at 1.7 months. This represents a modest 6.2% increase from the previous year, suggesting a relatively balanced market dynamics, though still leaning towards a sellers’ market due to the limited inventory.
Sales activity in the Indian Hills area has decreased slightly, with 3 homes sold, marking a 25% reduction from the prior year. This dip in closed sales could be attributed to various factors, including the decreased inventory and possibly more selective buyers.
Properties are moving faster than in the previous year, with the average days on market now at 18, a dramatic 65.4% decrease. This acceleration in sales pace highlights a market where demand remains strong, and well-priced, appealing properties are quickly attracting buyers.
Financially, the market has shown remarkable strength. The list-to-sold price ratio now averages 102.2%, an 8.5% increase from last year, indicating that homes are not only selling for their asking prices but often exceeding them. This trend points to a competitive environment where bidding wars are not uncommon, benefiting sellers with premium pricing.
The average sales price in Indian Hills has experienced substantial growth, reaching $799,167, representing a 39.7% increase from the previous year. This significant rise in property values underscores the area’s attractiveness and the robust investment potential of real estate within this community.
However, the average price per square foot has slightly decreased, down 3.2% to $336. This minor adjustment might reflect variations in the types of properties sold or a shift in market preferences, but does not detract from the overall positive momentum of the housing market in Indian Hills.
In summary, the Indian Hills residential market presents a landscape of reduced inventory but increased new listings, creating a dynamic transaction environment. Despite a slight drop in sales, the market remains highly competitive, with properties selling rapidly and often above asking price.
The significant appreciation in average sales price highlights the strong market fundamentals, offering promising opportunities for buyers and sellers. As always, navigating this market successfully requires nuanced understanding and strategic planning, areas where our expertise and dedication to our client’s needs can make a significant difference.
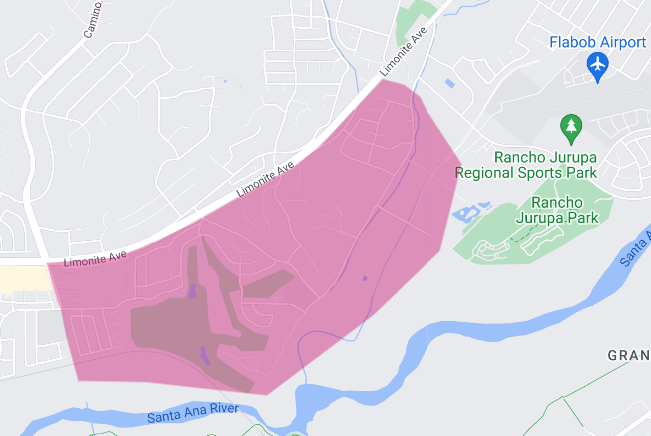
Area 6:
Pedley – East
Jurupa Valley, CA 92509
As we reflect on the real estate market for the East Pedley area for the month ending March 2024, it’s clear that the landscape has undergone notable changes, offering both challenges and opportunities for those looking to buy or sell in the area. This report aims to distill the key trends and metrics from the past month, providing a clear overview of the market’s current state.
The East Pedley residential area has seen a dramatic decrease in the number of active listings at the end of the month, with just 3 properties available. This represents a significant reduction of 66.7% from the previous year. Such a sharp decline in inventory indicates a tighter market, where potential buyers have fewer options to choose from, potentially leading to a more competitive environment for available homes.
In line with the decrease in active listings, new listings have also seen a substantial drop, with only 1 new property coming to market. This is an 85.7% decrease from the year prior, further highlighting the current scarcity of new options for potential buyers and the cautious stance of potential sellers in entering the market.
The months’ supply of inventory stands at 1.1 months, down 68.6% from last year, suggesting a market that is leaning heavily toward sellers. This metric underscores the limited availability of homes relative to the demand, a scenario that often results in upward pressure on prices and potentially quicker sales cycles for listed properties.
Interestingly, closed sales for the month remained stable with 2 transactions completed, matching the activity level from last year’s period. Despite the significant decrease in inventory and new listings, this stability in sales volume suggests a sustained demand for homes in the area.
The average days on the market for sold properties remained consistent at 6 days, indicating a market where homes sell rapidly. This pace reflects buyers’ ongoing demand and competitiveness, with desirable properties moving quickly from listing to sale.
The list-to-sold price percentage stands at 100.8%, showing that, on average, homes are selling slightly above their listing price. This metric has not changed from the previous year, maintaining a trend where sellers can expect to receive offers that meet or exceed their asking prices, a testament to the strength and competitiveness of the market.
Regarding financial metrics, the average sales price and average price per square foot have remained steady at $535,000 and $419, respectively. The stability of these figures, despite the dramatic shifts in inventory and listings, indicates a market that, while constrained in terms of supply, has retained its value proposition for buyers and sellers.
In summary, the East Pedley residential market is characterized by significantly reduced inventory and new listings, maintaining stable sales and pricing metrics. This environment suggests a highly competitive market for the limited available properties, with strong demand keeping sales activity robust and pricing stable. As we move forward, understanding these dynamics will be crucial for anyone looking to navigate the East Pedley real estate landscape successfully.
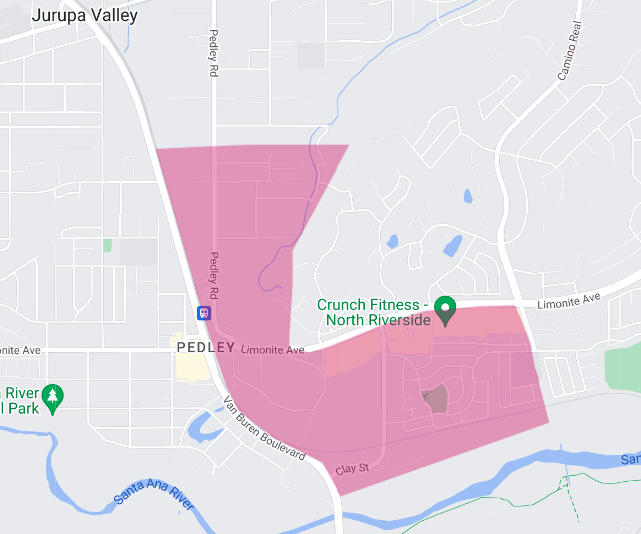
Area 7:
Pedley – West
Jurupa Valley 92509
March 2024 marks another pivotal moment for the western Pedley residential real estate market. It reflects a dynamic interplay of supply and demand that continues to shape the landscape for buyers and sellers alike. This report aims to distill the essence of this month’s activity, providing a clear and concise overview of the market’s current state.
The western Pedley area has seen a significant contraction in the number of active listings at the end of the month, with only 3 properties available. This represents a substantial decrease of 57.1% from the previous year, underscoring a tight market where buyers find themselves with limited options. This scarcity of available properties is indicative of a market that heavily favors sellers, where competition among buyers can be fierce.
In tandem with the decrease in active listings, new listings have plummeted, with just 1 new property introduced to the market. This dramatic 83.3% drop from last year further accentuates the scarcity of new offerings and could potentially lead to increased competition for any new properties that do come onto the market.
The months’ supply of inventory has decreased to just 0.8 months, a 60% reduction from the previous year. This highlights a market that is quickly absorbing available inventory. This pace suggests a highly competitive environment, where listings may receive multiple offers shortly after being listed.
Sales activity has significantly decreased, with only 1 closed sale reported for the month, marking an 85.7% decline from the previous year. This reduction could reflect the limited inventory and possibly a mismatch between buyer expectations and the properties available.
The average days on the market for sold properties has dramatically decreased to 8 days, an 89.2% reduction from last year. This rapid sales pace indicates that, despite fewer transactions, the demand for available homes remains high, with properties selling quickly once they hit the market.
Financially, the market has shown strength and resilience. The list-to-sold price percentage now averages 101.3%, a 7.7% increase from last year. This suggests that homes are not only selling at their asking prices but often above, a clear sign of a competitive bidding environment.
The average sales price in the Western Pedley area has risen to $779,391, a 15% increase from the previous year. This growth, calculated on a rolling 3-month average, reflects a healthy appreciation in property values, benefiting sellers and indicating a strong market.
Similarly, the average price per square foot has seen an 8.5% increase, reaching $345. This rise, also based on a rolling 3-month average, further evidences the area’s desirability and the overall health of the real estate market.
In conclusion, the Western Pedley residential real estate market presents a scenario of reduced inventory and significantly fewer new listings, maintaining a highly competitive market for the limited available properties.
Despite the decrease in closed sales, the rapid sales pace and the appreciation in both average sales price and price per square foot highlight a robust market. For buyers, the current conditions suggest the importance of readiness and decisiveness, while sellers can expect favorable outcomes but must also navigate the challenges of finding their next home in a tight market.
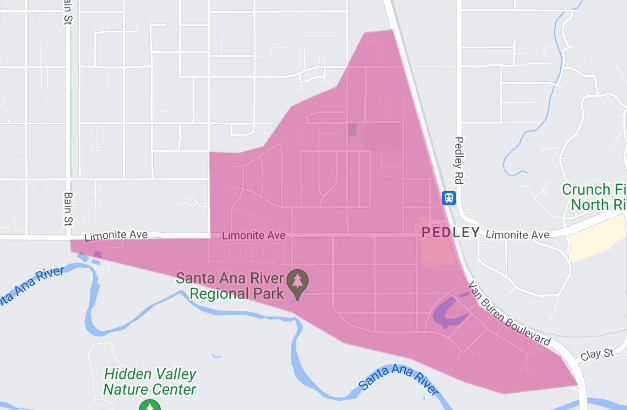
Area 8:
Mira Loma-East
Jurupa Valley 92509
As we conclude March 2024, here are the latest insights from the east Mira Loma residential real estate market. This month’s report captures significant trends and shifts, providing a detailed overview that is essential for anyone looking to navigate this dynamic market, whether you’re buying, selling, or simply keeping an eye on your investment.
In a notable trend, the eastern Mira Loma area experienced a drastic reduction in active listings at the end of the month, with only 1 property available. This marks a 75% decline from the previous year, signaling a tight market where potential buyers face limited options. This scarcity of available homes underscores a significant imbalance between supply and demand, potentially leading to heightened buyer competition.
Despite the decrease in active listings, new listings remained stable, with 2 properties introduced to the market, maintaining the same level of new entries as the previous year. This steadiness in new listings suggests a continued interest among sellers in engaging with the market, albeit not enough to significantly alter the overall scarcity of available homes.
The months’ supply of inventory has plummeted to just 0.4 months, an 81% reduction from last year. This dramatic decrease further highlights the competitive nature of the East Mira Loma market, with available properties being absorbed at an unprecedented rate, indicating a market that strongly favors sellers.
Sales activity, however, tells a more positive story, with closed sales doubling to 4, a 100% increase from the previous year. This surge in sales activity amidst a backdrop of reduced inventory suggests that despite the limited options, buyer demand remains robust, with properties attracting interest and closing swiftly.
The average days on market for properties sold has decreased to 26 days, down 27.8% from the previous year. This reduction in days on market reflects a quicker turnover rate, with homes selling faster than in the previous year, a testament to the strong demand within the East Mira Loma area.
Financial metrics offer additional insights into the market’s dynamics. The list to sold price percentage now stands at an impressive 104.8%, a significant 10.7% increase from the previous year. This metric indicates that homes are not only selling at their asking price but often exceeding it, reflecting aggressive bidding and a competitive market environment favorable to sellers.
The average sales price has seen a notable increase, rising to $774,500, which is a 22.9% increase from the previous year. This appreciation of home values highlights the area’s desirability and the strong market conditions that benefit homeowners and investors alike.
Conversely, the average price per square foot experienced a slight decrease, down 0.8% to $386. This minor adjustment may reflect variances in the types of properties sold or specific market fluctuations but does not significantly detract from the overall positive trend in property values.
In conclusion, the East Mira Loma residential real estate market has demonstrated remarkable dynamics over the past month, characterized by a significant contraction in inventory and a robust increase in sales activity. The substantial appreciation in average sales prices, combined with properties selling above the asking price, underscores a highly competitive market.
For buyers, the current landscape presents challenges due to the limited inventory, requiring swift decision-making. Sellers, on the other hand, are positioned advantageously, likely to benefit from favorable sale conditions and premium pricing. Navigating this market effectively will require strategic insights and timely action, areas where our expertise can provide invaluable guidance and support.
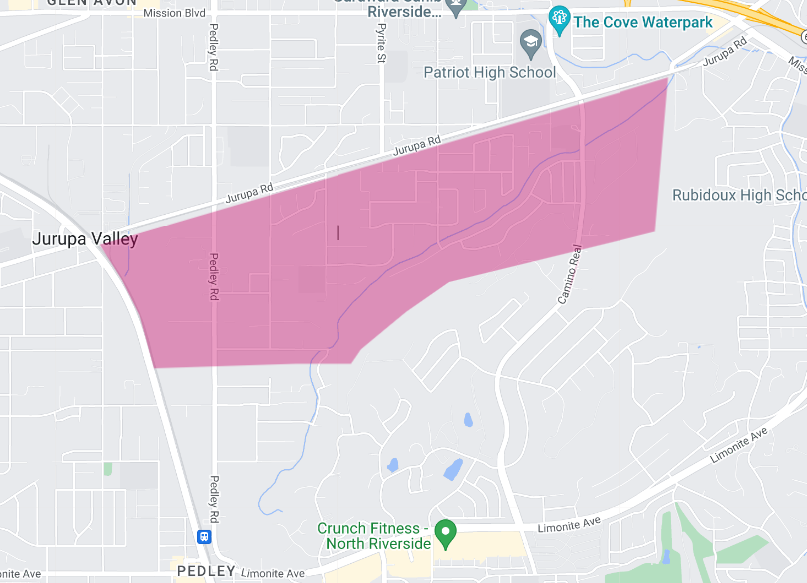
Area 9:
Jurupa – Stone
Jurupa Valley 92509
March 2024 has been an eventful month in the Jurupa-Stone residential real estate market, revealing trends and changes that are essential for homeowners, buyers, and investors to understand. This report aims to provide a comprehensive overview of the current market conditions, highlighting the dynamics that are shaping the landscape of residential real estate in this vibrant community.
The Jurupa-Stone area has witnessed a significant increase in market activity, starting with the end-of-month active listings which have doubled to 6 properties. This 100% increase from the previous year indicates a more dynamic market, with a broader selection of homes available for potential buyers. The increase in inventory is a positive sign for those looking to purchase in the area, offering more options and variety.
Similarly, new listings have seen a substantial rise, with 2 new properties entering the market, marking a 100% increase from the previous year. This growth in new listings contributes to the enhanced dynamism and fluidity of the Jurupa-Stone real estate market, potentially attracting more interest from buyers and creating a more vibrant market environment.
The months’ supply of inventory has experienced a dramatic upsurge, now standing at 4.0 months, a significant 300% increase from last year. This considerable growth in inventory levels suggests a shift towards a market more balanced between buyers and sellers. It indicates that buyers may have more leverage and options available, potentially easing the competitive pressure seen in tighter markets.
In terms of sales activity, the market has maintained stability, with 1 closed sale reported, mirroring the activity level from the previous year. This steadiness in closed sales, despite the increase in inventory and new listings, may reflect a cautious approach from buyers or a mismatch between the properties available and buyer preferences.
The average days on market for sold properties has dramatically increased to 25 days, up 212.5% from the previous year. This considerable lengthening in the time it takes to sell a property suggests a slower-paced market where homes may not be moving as quickly as before, potentially giving buyers more time to make decisions.
Financially, the Jurupa-Stone area has seen mixed results. The list to sold price percentage has slightly decreased to 102.2%, a minor 2.2% drop from the previous year. While homes are still selling for more than their listing price on average, the slight decrease might indicate a softening in the market’s competitive intensity.
The average sales price has continued to grow, reaching $695,000, a 7.5% increase from the previous year. This appreciation in property values, calculated using a rolling 3-month average, suggests that despite the broader changes in the market, Jurupa-Stone remains an attractive area with strong investment potential.
However, the average price per square foot has seen a decrease, down 11.8% to $306. This reduction may reflect changes in the types of properties sold or varying market conditions but highlights the complexity of the current real estate landscape in Jurupa-Stone.
In conclusion, the Jurupa-Stone residential real estate market has experienced significant changes over the past month, marked by increased inventory and new listings, stable sales activity, and a mix of financial indicators. As the market evolves, both buyers and sellers must navigate these dynamics carefully, leveraging the latest insights to make informed decisions. The current environment presents unique opportunities and challenges, underscoring the importance of strategic planning and market awareness.
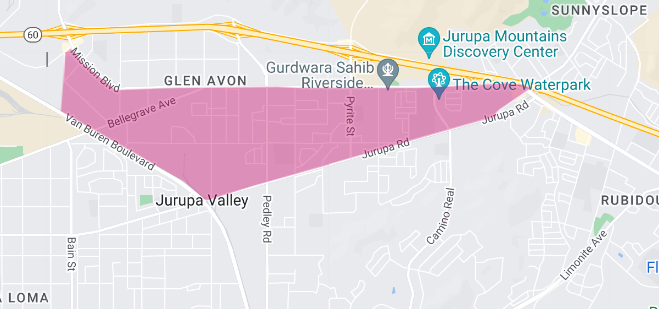
Area 10:
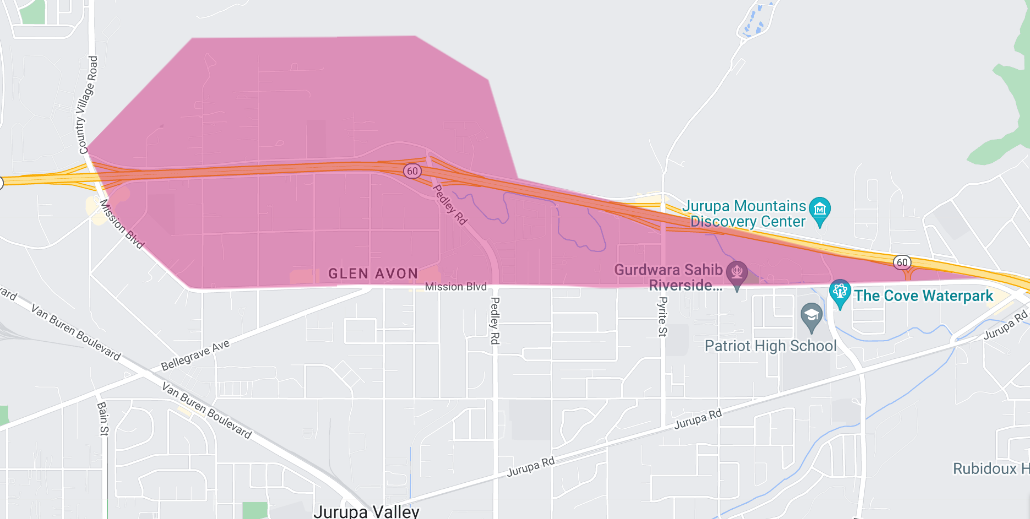
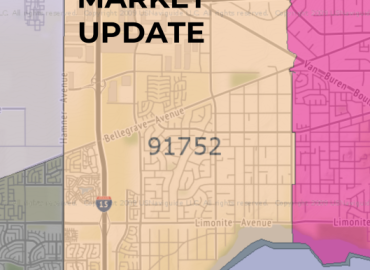
Glen Avon – South
Jurupa Valley 91752
March 2024 has brought a set of intriguing developments to the South Glen Avon residential real estate market, presenting a unique landscape for those interested in this area. This report aims to navigate through the current market conditions, offering a clear and insightful analysis for our clients.
This month, the South Glen Avon area witnessed a dramatic decrease in the number of active listings, with only 1 property available by the end of the month. This represents an 87.5% decline from the previous year, signaling an exceptionally tight market. The scarcity of available properties is a significant factor for potential buyers, highlighting the importance of readiness and decisiveness in this competitive landscape.
Adding to the constrained market conditions, there were no new listings introduced in March, a stark contrast from the previous year and marking a 100% decrease. This absence of new listings further exacerbates the limited availability of homes, contributing to the challenging environment for buyers eager to enter the market.
The months’ supply of inventory has sharply declined to just 0.3 months, an 85% reduction from last year. This metric underscores the rapid pace at which homes are being sold, indicating a market that is heavily skewed in favor of sellers. The extremely low inventory suggests that demand far outstrips supply, creating a scenario where listings may receive immediate and competitive offers upon entering the market.
Despite the constrained inventory, closed sales have seen a remarkable increase, doubling to 4 transactions from the previous year. This 100% surge in sales activity demonstrates robust demand within the South Glen Avon area, with buyers actively pursuing the few available properties.
The average days on the market for sold properties have increased to 46 days, a 53.3% rise from the previous year. This increase suggests that while demand remains strong, there may be more negotiation and deliberation involved in the sales process, potentially reflecting the higher stakes in a market with so few listings.
Financial indicators reveal a market experiencing significant appreciation. The list-to-sold price percentage slightly increased to 100.1%, indicating that properties are selling at just above their asking price. This modest 1.6% change from the previous year suggests a market where pricing remains competitive, with sellers achieving their desired sale prices.
The average sales price in the South Glen Avon area has risen to $752,475, a 24.1% increase from the previous year. This appreciation highlights the area’s desirability and the overall strength of the real estate market, benefiting homeowners and investors alike.
Moreover, the average price per square foot has experienced a substantial surge, up 52.7% to $481. This significant increase further demonstrates the market’s robustness and the heightened value of properties in this locale.
In summary, the South Glen Avon residential real estate market is characterized by its extremely tight inventory, reflected in the dramatic decrease in active and new listings. The notable increase in closed sales, coupled with the significant appreciation in sales prices and price per square foot, underscores a highly competitive and dynamic market environment.
For buyers, the current conditions underscore the necessity for quick action and flexibility, while sellers are in a favorable position to capitalize on the strong demand and premium property values. Navigating this market successfully requires an in-depth understanding of these trends and strategic planning, areas where our expertise and guidance can provide invaluable support.
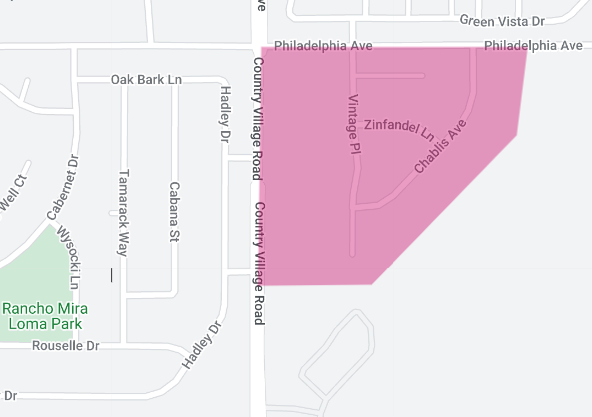
Area 11:
California Horizon,
Jurupa Valley 91752
As of March 2024, the California Horizon residential area has experienced an unprecedented period characterized by a standstill in market activity. This report aims to provide an overview of the current state of the real estate market in this community, even as we face a unique scenario.
For the month ending in March 2024, the California Horizon area reported no end-of-month active listings, maintaining the same status as the year before. This lack of inventory is highly unusual and signifies a stagnation in the market where neither new nor existing homes are available for sale. The absence of new listings further emphasizes this point, with no properties being introduced to the market this year, mirroring the situation from the previous year.
Given the zero inventory, there is no applicable data for months’ supply of inventory. This metric, which typically helps gauge the balance between supply and demand, cannot be calculated without active or new listings, presenting a challenge for understanding market dynamics in traditional terms.
Similarly, there were no closed sales during the month, indicating no change from the previous year. This lack of sales activity further underscores the current standstill in the California Horizon market. Without closed sales, there is also no data available for average days on market and list to sold price percentage, metrics that usually offer insights into the pace and negotiation dynamics of the market.
Due to the absence of recent sales, it’s also impossible to determine an accurate average sales price for the current period. The last known sale in the area occurred in December 2022, involving a 1600 square foot, 3 bedroom/3 bathroom property. This home was originally listed for $589,000 on October 7, 2022, and successfully closed on December 5, 2022, for $549,800, with a price per square foot of $343.62. This sale provides a snapshot of market conditions at that time but does not reflect the current state due to the lack of recent transactions.
In summary, the California Horizon residential real estate market is currently experiencing a period of inactivity, with no new or active listings and no closed sales. This stagnation presents a challenge for buyers, sellers, and real estate professionals alike, as the usual metrics and trends that guide decision-making are absent. The last recorded sale offers a glimpse into the market’s past performance, but the absence of current data highlights the need for innovative approaches and strategies to reinvigorate the market and encourage listings and sales activity in the future.
Area 12:
Glen Avon,
Jurupa Valley 92509
March 2024 has unfolded with notable developments within the Glen Avon residential real estate market, reflecting both the challenges and opportunities that characterize this dynamic environment. This report delves into the current state of the market, providing essential insights for buyers, sellers, and those monitoring the pulse of Glen Avon’s real estate landscape.
The market has seen a decrease in the number of active listings at the end of the month, with just 2 properties available. This represents a 33.3% reduction from the same period last year, indicating a tighter market with fewer options for potential buyers. The scarcity of listings underscores the competitive nature of the market and may lead to increased competition for available homes.
In tandem with the decrease in active listings, new listings have also experienced a significant reduction, halving to just 1 new property entering the market. This 50% drop from the previous year further accentuates the limited availability of homes for sale, posing a challenge for buyers seeking entry into the Glen Avon market and indicating a cautious stance from potential sellers.
The months’ supply of inventory stands at 1.3 months, marking a 43.5% decline from last year. This reduction highlights a market that is moving towards greater scarcity, with inventory levels shrinking and suggesting a sellers’ market where demand outpaces supply.
Sales activity is represented by 1 closed sale for the month, although we lack comparative data from the previous year to gauge the change in sales volume. Nevertheless, this sale contributes to our understanding of the market’s dynamics and activity level.
The average days on the market for properties have remained low at 6 days, indicating a rapid pace of sales. Properties in Glen Avon are moving quickly, reflecting strong buyer interest and the competitiveness of the market, although specific comparative data from the previous year is not available.
Financial metrics provide a brighter spot in the analysis, with the list-to-sold price percentage averaging 101.3%. This figure suggests that homes are generally selling for slightly above their asking price, a favorable condition for sellers that reflects the competitive bidding environment in Glen Avon.
The average sales price has seen a substantial increase, reaching $666,000, which is a significant 54.9% increase from the previous year. This appreciation, calculated using a rolling 3-month average, underscores the desirability of the Glen Avon area and the value buyers place on properties within this market.
Furthermore, the average price per square foot has surged to $563, a remarkable 95.5% increase from last year, based on a rolling 3-month average. This dramatic rise indicates a strong market performance and significant appreciation in property values, benefiting homeowners and attracting investors.
In summary, the Glen Avon residential real estate market is characterized by decreased available inventory and new listings, contributing to a competitive and fast-paced market environment. Despite these challenges, the significant appreciation in the average sales price and price per square foot highlights the area’s strong demand and investment potential. For buyers, the current market conditions necessitate quick decision-making and flexibility, while sellers are positioned advantageously to capitalize on the high demand and favorable pricing. As we move forward, navigating the Glen Avon market will require strategic insight and careful consideration of these evolving dynamics.
*************
As a real estate broker, understanding the nuanced market shifts in the above residential area market update reports is key to providing informed advice and strategy to sellers throughout the 92509 – zip code area.
Contact me for a comprehensive understanding of how the trends above can impact your real estate decisions. I provide expert guidance and strategic insights and can help you through these interesting times in real estate.
Manny Barba
Broker-Attorney-Realtor®
951-990-3998
MB Live Realty, Inc.
Note: All data in this report is from California Regional Multiple Listing Service (CRMLS) All information should be independently reviewed and verified for accuracy. This report is for informational purposes only and not intended as financial or investment advice.
![]()
No Comments