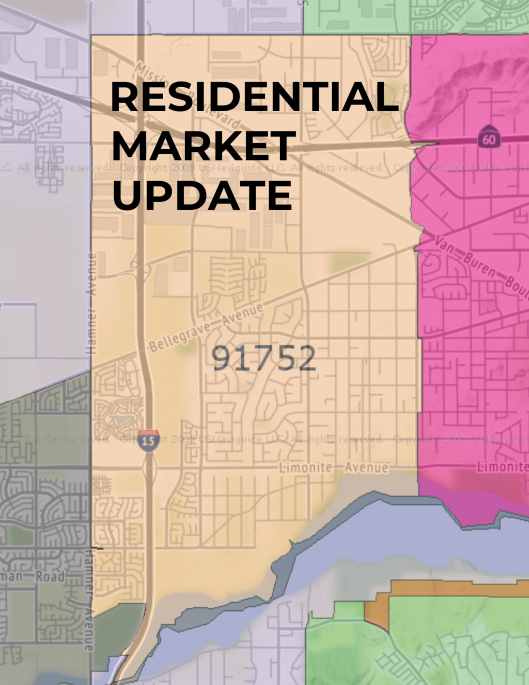
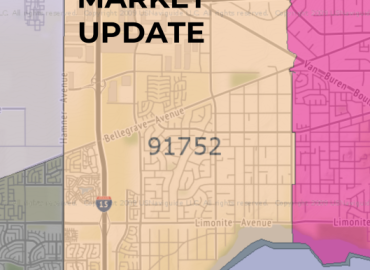
91752 Residential Real Estate Market Update (Jurupa Valley-Eastvale) – January 2024
The 91752-zip code, located in Riverside County, California, encompasses a small part of the city of Eastvale (east of Hamner Avenue) and the western part of the city of Jurupa Valley (Mira Loma area). The history of the ’52 zip code is closely tied to the development of these communities. Here’s a brief overview:
Throughout the 19th and early 20th centuries, the area was predominantly agricultural. It was known for its dairy farms and fields of crops, which benefited from the region’s fertile soil and favorable climate.
After World War II and into the 20th century, like many areas in Southern California, the region began to transform. The growth of the Los Angeles metropolitan area, improvements in transportation, and the increasing demand for suburban housing led to the development of residential communities, eventually becoming the cities of Eastvale and Jurupa Valley.
Today, the 91752-zip code is characterized by its suburban residential communities, commercial developments, and remaining agricultural areas. It is a reflection of the larger trends in Southern California’s Inland Empire – a shift from rural to suburban and urban landscapes.
The history of the 91752-zip code is a microcosm of the broader changes in Southern California – from indigenous lands to agricultural heartland, to a thriving suburban area. It reflects the dynamic and ever-evolving nature of the region.
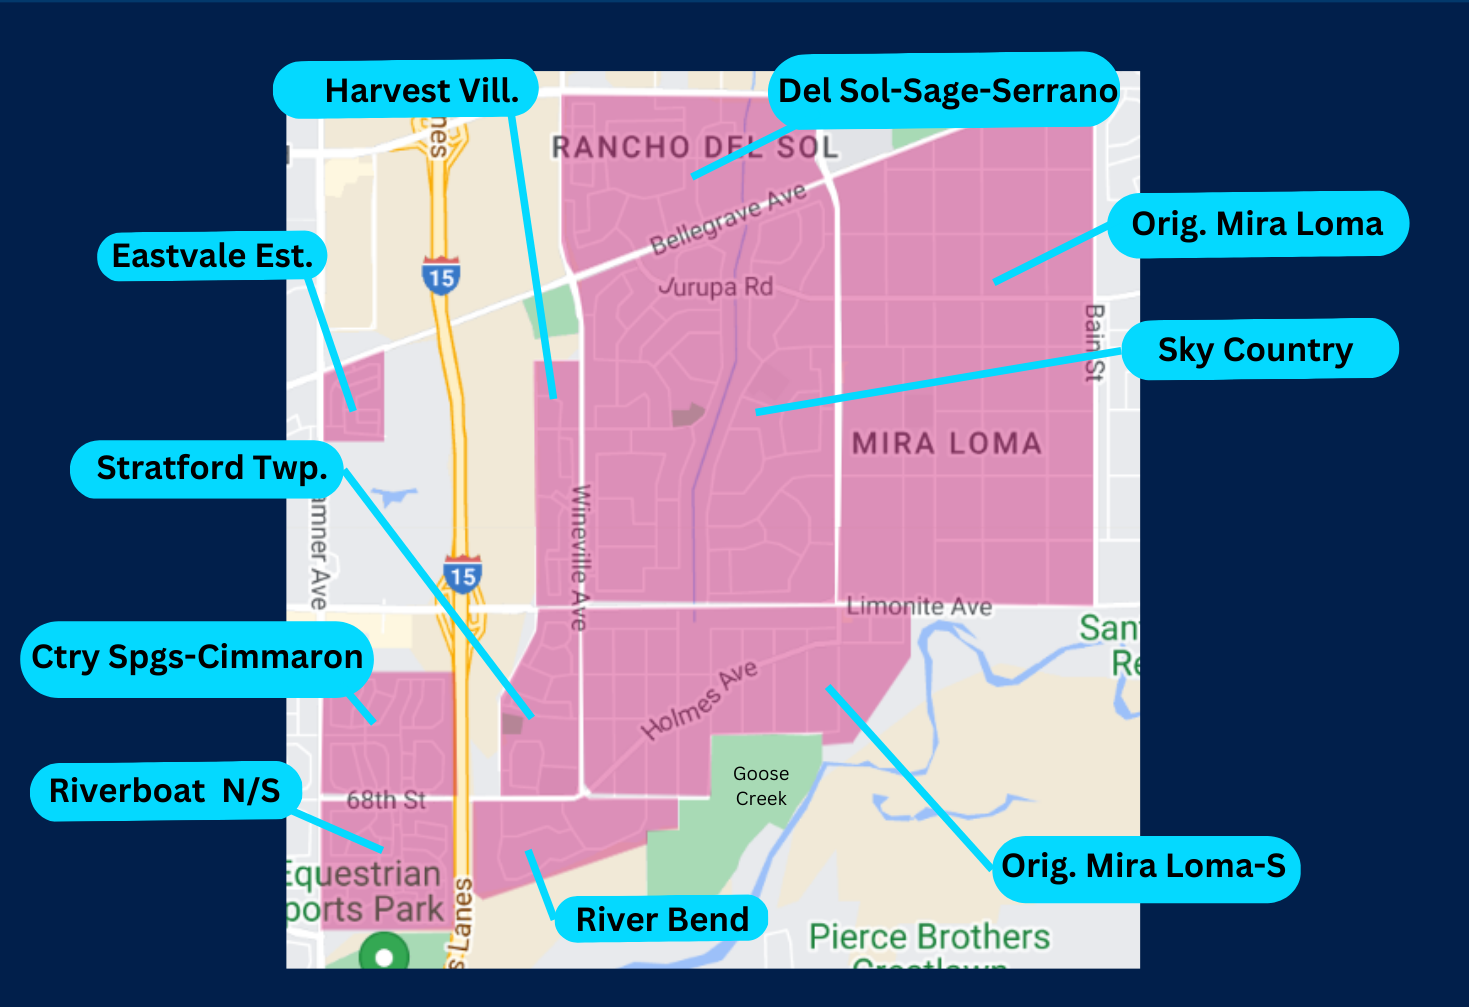
The data that follows is not intended to be a comparative market analysis for any one particular home, but instead gives a general valuation for homes in each of the 12 specified areas, and in whole the entire residential areas located in the 91752-zip code.
For a detailed and personalized market analysis of your home, or if you have any questions, feel free to contact me.
Manny Barba,
Broker-Attorney-Realtor®
DRE #00879806
951-990-3998
mail@mbliverealty.com
MB Live Realty, Inc.
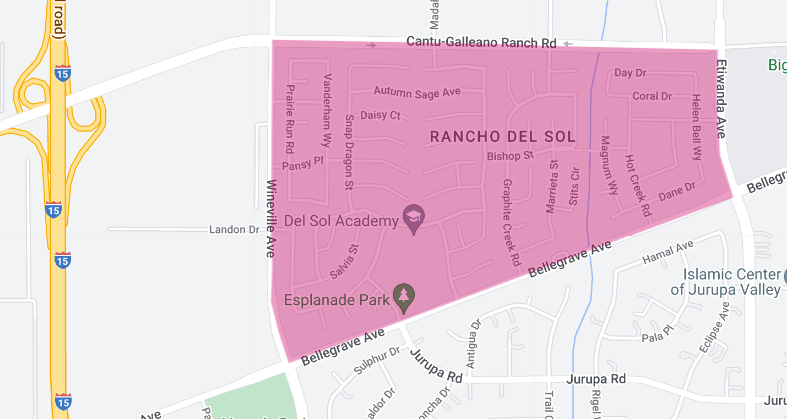
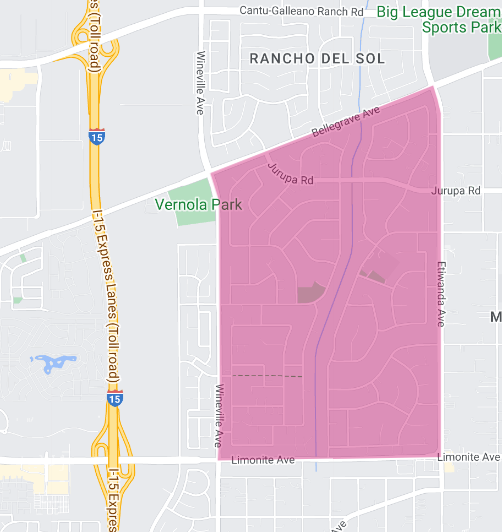
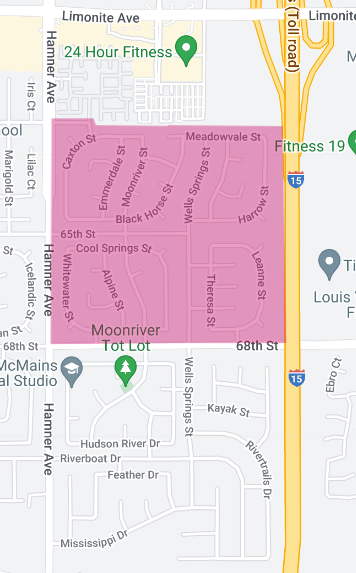
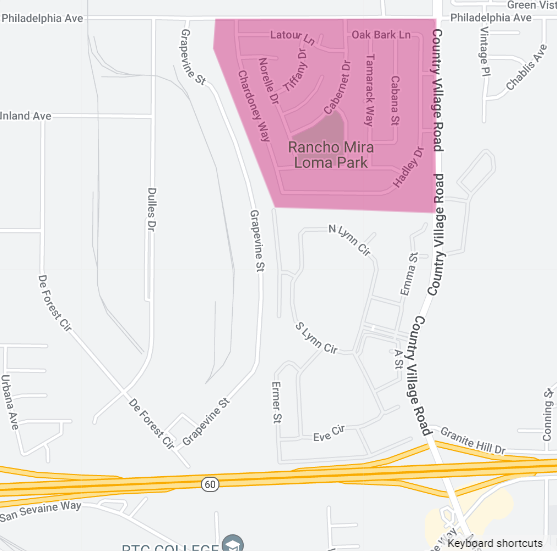
Area: Rancho Del Sol-Sage Pointe-Serrano Ranch area of homes,
(Western portion of Jurupa Valley 91752)
In this latest residential real estate market report for the Rancho Del Sol-Serrano Ranch area for the month ending January 2024, we observe several significant trends that highlight the current dynamics within this local market.
To begin, the number of active listings at the end of the month stood at just three properties, indicating a substantial decrease of 70% from the previous year. This significant contraction in inventory shows a tight market where fewer homeowners are choosing to list their properties. Additionally, the market saw only one new listing during the month, which is a 66.7% decline from the year prior. This reduction in new listings further emphasizes the scarcity of available properties for potential buyers in the Del Sol-Sage-Serrano area.
The months supply of inventory, a metric indicating how long the current inventory of properties would last at the current rate of sales without new listings coming to market, was recorded at 1.2 months. This represents a 64.7% decrease from the previous year, underscoring a rapidly moving market where demand outpaces supply.
Closed sales for the month were notably higher, with three properties sold, marking a 200% increase from the previous year. This surge in closed sales, despite the low inventory, indicates a strong buyer interest and a competitive market environment.
The average days on market for properties sold was 35 days, showing a significant decrease of 52.7% from last year. This faster turnover rate reflects a market where properties are selling quickly due to strong demand and limited inventory.
The list-to-sold price percentage, an indicator of how close the final selling price is to the listing price, stood at 95.5%, a 5% increase from the previous year. This suggests that homes are selling closer to their asking prices, indicating a market condition that favors sellers.
Regarding prices, the average sales price for homes in the Rancho Del Sol-Serrano Ranch area was $831,667, which is a slight increase of 0.8% from the previous year. The average price per square foot has seen a significant increase of 40.9% to $341, highlighting an appreciation in property values within the area.
In summary, the Rancho Del Sol-Serrano Ranch residential real estate market for January 2024 shows a landscape of limited inventory and strong demand. The substantial decrease in active and new listings, combined with a significant increase in closed sales and a reduction in average days on market, underscores a competitive market environment. The increase in the list-to-sold price percentage and the appreciation in average sales price and price per square foot further indicate a market that is increasingly favorable to sellers.
Potential buyers in this area should be prepared for a competitive market scenario, while sellers may find it an opportune time to list their properties.
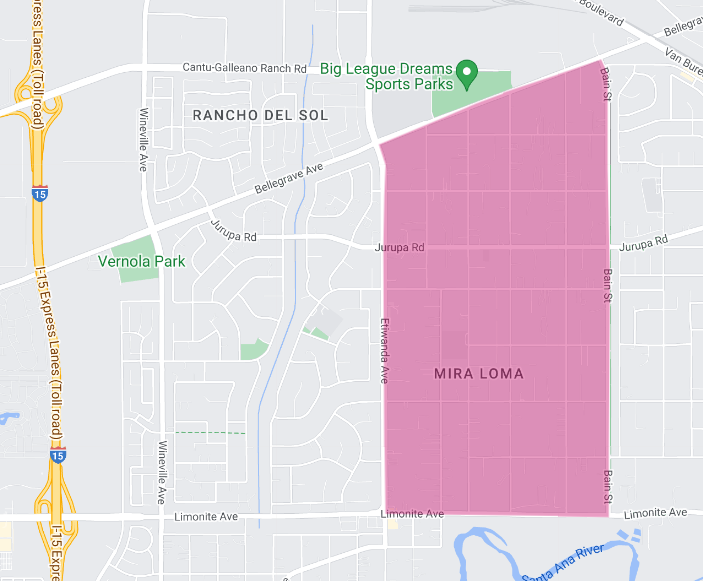
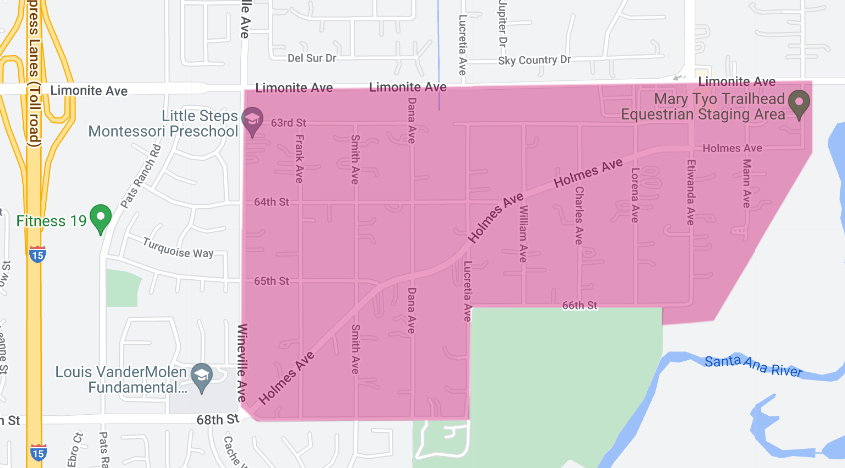
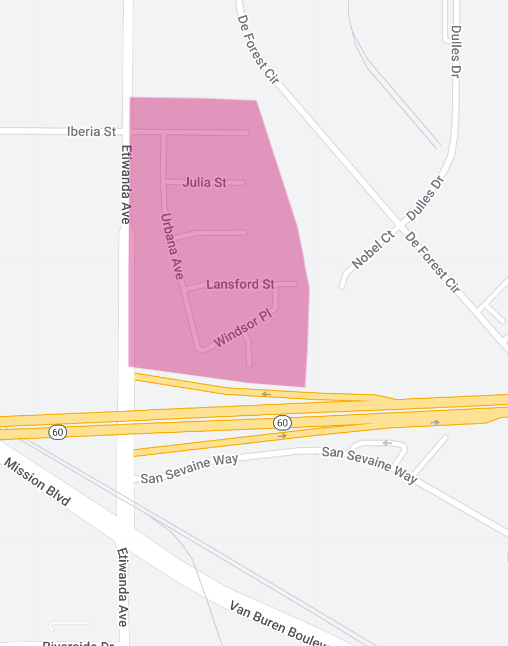
Area: Central Mira Loma (original)
(Western portion of Jurupa Valley 91752)
The residential real estate market in the original Mira Loma area for the month ending January 2024 presents a unique set of dynamics, characterized by significantly limited inventory and a mixed performance in sales activity and pricing trends.
The market experienced a dramatic decrease in available properties, with the end of month active listings standing at just one property. This represents an 83.3% decline from the previous year, indicating a severely constricted inventory that is contributing to competitive conditions for buyers.
Furthermore, there were no new listings introduced to the market during the month, a stark decrease of 100% from last year, further exacerbating the shortage of available homes.
The months supply of inventory, which measures how many months it would take to sell the current inventory at the current sales rate, dropped to 0.6 months. This 80% decrease from the previous year suggests an extremely fast-moving market, where demand significantly outstrips supply.
Closed sales in the area saw a decrease, with only one property sold during the month, reflecting a 50% drop from the previous year. This reduction in closed sales, despite the low inventory, could indicate a mismatch between buyer expectations and the properties available, or perhaps a hesitancy due to broader market conditions.
Properties are selling more quickly than in the previous year, with the average days on market now at 18 days, a 55% decrease. This rapid turnover rate is a clear indicator of continued buyer interest and the competitive nature of the market, despite the lower volume of transactions.
The list to sold price percentage, which provides insight into the negotiation dynamics between buyers and sellers, stood at 95.5%. This represents a decrease of 5.4% from the previous year, suggesting that buyers may have gained slightly more negotiation leverage compared to the previous year, or that sellers are adjusting their expectations in response to market conditions.
In terms of pricing, the market has seen appreciable growth. The average sales price reached $728,833, marking a 12.9% increase from the previous year based on a rolling 6-month average. This increase highlights the area’s desirability and the premium buyers are willing to pay for properties in this location.
The average price per square foot also rose to $478, a 9.9% increase from the previous year, further emphasizing the area’s value appreciation.
In summary, the original Mira Loma residential real estate market for January 2024 is marked by a dramatic scarcity of inventory, which has influenced all aspects of the market.
The significant decrease in active and new listings has created a highly competitive environment, despite a reduction in the number of closed sales. The rapid sale of available properties and the appreciable increase in both the average sales price and price per square foot reflect a market that remains attractive to buyers, highlighting the enduring appeal of the original Mira Loma area.
This scenario suggests a market poised for intense competition among buyers, while sellers who do decide to enter the market may find it advantageous, given the strong appreciation in property values.
Area: Sky Country,
(Western portion of Jurupa Valley 91752)
In the Sky Country residential area, the real estate market update for January 2024 reveals several key trends that reflect the current state of the market, offering insights into both opportunities and challenges facing buyers and sellers.
The end-of-month active listings totaled three, marking a decrease of 25% from the year prior. This reduction in active listings suggests a slight tightening of the market, although not as pronounced as in other areas or markets.
On a more positive note, new listings saw a significant uptick, doubling from the previous year to two new listings. This increase indicates a willingness among some homeowners to enter the market, providing a modest but welcome boost to the available inventory.
The months supply of inventory, which measures the balance between supply and demand by indicating how many months it would take for the current inventory to sell given the current sales pace, stood at 1.7 months. This represents an increase of 13.3% from the previous year, suggesting a slight shift towards a more balanced market, albeit still favoring sellers with a relatively low inventory level.
Closed sales remained steady with one sale, unchanged from the previous year. This stability in closed sales, against the backdrop of fluctuating inventory levels, suggests a market where demand is being met but not exceeded, pointing towards a relatively stable buying and selling environment.
The average days on market for properties significantly decreased to 34 days, a sharp reduction of 76.2% from the previous year. This dramatic decrease indicates that properties are selling much faster than before, a sign of strong demand and potentially a competitive environment for buyers.
The list to sold price percentage stood at 97.8%, slightly decreasing by 1.5% from the previous year. This minor adjustment suggests that while sellers are still achieving close to their asking price, there may be a slight increase in negotiation room for buyers compared to the previous year.
In terms of pricing, the average sales price saw a slight decrease of 3.0% from the previous year to $794,667, based on a rolling 6-month average. This dip in the average sales price might reflect a variety of factors, including the mix of homes sold, buyer preferences, or slight adjustments in market dynamics.
Conversely, the average price per square foot increased by 6.8% to $455, using a rolling 6-month average calculation. This increase in price per square foot, even as the overall average sales price dipped, could indicate that smaller homes or those with higher-end finishes and locations within the area are commanding premium prices, or that the market is valuing specific home features more highly.
In conclusion, the Sky Country residential real estate market in January 2024 presents a mixed picture with both challenges and opportunities. While the decrease in active listings and the modest increase in new listings suggest a competitive market, the significant decrease in average days on market indicates strong demand. The slight decrease in the average sales price contrasts with the increase in price per square foot, pointing to nuanced market dynamics.
Buyers may find competition for available homes but also some room for negotiation, while sellers can benefit from a market that still values properties highly, albeit with nuanced shifts in price dynamics.
Area: Mira Loma – South (original)
(Western portion of Jurupa Valley 91752)
The real estate market update for the original Mira Loma-South residential area for January 2024 highlights a series of mixed trends that reflect the current state and potential future directions of this local market.
At the end of January 2024, the active listings in the original Mira Loma-South stood at only one property, marking a significant reduction of 50% from the previous year. This decrease in active listings indicates a tight market with fewer options available for potential buyers.
Despite this decrease in inventory, the number of new listings remained stable year-over-year, with one new property coming to the market. This stability in new listings, against a backdrop of reduced overall inventory, suggests a cautious approach from sellers or potentially limited readiness to sell among homeowners in the area.
The months supply of inventory, which provides an indication of the balance between supply and demand by estimating how long the current inventory of homes would last at the current sales pace, dropped significantly to just 0.8 months. This represents a 50% decrease from the previous year, further emphasizing the scarcity of available homes and a market that leans heavily in favor of sellers, given the limited supply.
Interestingly, the area reported no closed sales during the month, a stark contrast from the previous year and indicating a complete halt in transactional activity. This absence of sales activity makes it impossible to provide data on the average days on market or the list-to-sold price percentage, as there were no transactions to analyze.
The lack of sales could be due to various factors, including potential buyers being priced out of the market, a mismatch between available properties and buyer preferences, or other economic conditions affecting buyer confidence and ability to purchase.
Despite the standstill in sales activity, the average sales price in the original Mira Loma-South area has increased by 9.0% from the previous year, reaching $601,667. This increase, calculated using a 6-month rolling average, suggests that the properties in the area have appreciated in value, possibly due to inherent desirability, improvements in the neighborhood, or overall market conditions favoring price growth in residential real estate.
Conversely, the average price per square foot experienced a decrease of 6.8%, settling at $453. This decline, also calculated using a 6-month rolling average, could reflect a shift in the types of properties being sold, possibly indicating that larger homes, which typically have a lower price per square foot, have been more common in sales contributing to this average or adjustments in market valuations.
In conclusion, the original Mira Loma-South residential area is currently experiencing a tight market with significantly reduced inventory and a complete absence of sales activity for the month of January 2024. While the increase in the average sales price suggests that the area remains desirable and properties continue to appreciate in value, the decrease in the average price per square foot and the halt in sales underscore the complexities and challenges facing this market.
Potential buyers and sellers in the original Mira Loma-South area must navigate these dynamics carefully, considering the scarcity of available properties and the shifting landscape of property values and market demand.
sellers.
Area: River Bend Homes
(Western Edge of Jurupa Valley 91752)
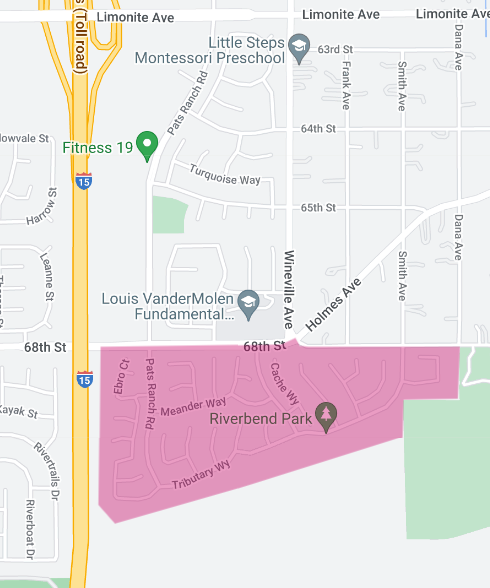
The River Bend residential area’s real estate market report for the month ending January 2024 showcases significant shifts and trends, reflecting both the evolving dynamics of the local market and broader patterns that may influence future activity.
The end-of-month active listings saw a remarkable increase, with three properties available, which represents a 200% increase from the previous year. This substantial rise in active listings suggests a notable influx of inventory, offering more options to potential buyers and indicating a possible shift towards a more balanced market compared to the constrained conditions of the previous year.
Interestingly, the number of new listings introduced to the market in January remained stable, with two new properties, showing no change from the year prior. This steadiness in new listings, against the backdrop of an overall increase in inventory, suggests that while there has been a significant year-over-year increase in available properties, the rate at which new listings are entering the market has remained consistent.
The months supply of inventory, a key metric indicating the balance between supply and demand by estimating how long the current inventory would last at the current sales pace, increased dramatically to 1.5 months. This 200% increase from the previous year indicates a significant shift towards a market with more available inventory, potentially easing competition among buyers and moving towards a more balanced market dynamic.
Closed sales remained constant with one property sold, mirroring the activity from the previous year. This stability in sales volume, despite the increase in inventory, may suggest a careful consideration by buyers or a market in which demand is adjusting to the newly available options.
The average days on market experienced a substantial increase to 42 days, a 281.8% change from the previous year. This significant lengthening in the time properties spend on the market before selling indicates a slowdown in transaction velocity, possibly due to buyers taking more time to make decisions amidst increased options or negotiating more vigorously.
The list to sold price percentage slightly decreased to 99.5%, a minor adjustment of 0.4% from last year. This high percentage continues to indicate a market where properties sell very close to their listing price, suggesting that despite an increase in inventory and longer days on market, selling prices remain strong and are closely aligned with listing expectations.
In terms of pricing, the average sales price saw a slight decrease of 1.9% to $883,062, based on a rolling 6-month average. This modest dip in sales price could reflect a nuanced adjustment in market valuations or possibly the types of properties sold during this period.
Conversely, the average price per square foot increased by 13.2% to $308, based on a rolling 6-month average. This increase indicates a rising valuation of property space within the area, suggesting that while overall prices have slightly adjusted downwards, the value attributed to the space within properties has grown, possibly reflecting a premium on quality, location, or other property features.
In summary, the River Bend residential area’s real estate market for January 2024 indicates a market experiencing significant shifts, with increased inventory and longer selling times juxtaposed against stable sales volume and strong price per square foot valuations.
The market appears to be moving towards a more balanced state, offering opportunities for both buyers and sellers. Buyers may find more options and potentially less competition, while sellers can still achieve close to their listing prices, albeit with potentially longer selling periods.
Area: Riverboat Rd. Area Homes
(Western Edge of 91752 ZIP Code, Eastvale, CA)
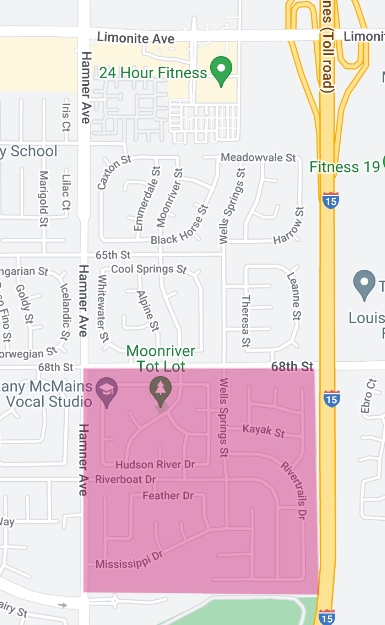
In the residential area adjacent to Riverboat Rd. (north and south), the real estate market update for January 2024 presents a nuanced view of the local market conditions, characterized by significantly reduced inventory and stable pricing trends compared to the previous year.
The end-of-month active listings stood at just one property, representing an 80% decrease from the previous year. This substantial reduction in active listings signifies a markedly constrained market, with very few options available for potential buyers.
The scarcity of available properties is further underscored by the new listings metric, which also saw a reduction, with only one new listing introduced to the market, marking a 50% decrease from the year before. This decrease in new listings contributes to the ongoing tightness in inventory levels, limiting the choices for buyers navigating the market.
The months supply of inventory, which indicates how many months it would take for the current inventory of homes on the market to sell given the current pace of sales, fell dramatically to 0.7 months. This represents a 75.9% decrease from the previous year, further highlighting the significant tightening of the market and the swift pace at which properties are expected to sell.
Closed sales remained steady, with one property sold during the month, showing no change from the previous year. This stability in sales volume, amidst a backdrop of reduced inventory, suggests a balanced level of demand that matches the constrained supply, leading to a market that is steady but highly competitive for available properties.
The average days on market for properties increased to 78 days, a 28.4% decrease from last year. This reduction indicates that, on average, properties are selling faster than in the previous year, a sign of a potentially competitive market environment where well-priced and desirable properties are moving more quickly.
The list to sold price percentage saw an increase to 95.1%, a 5.4% change from the previous year. This improvement suggests that sellers are achieving closer to their asking price, indicative of a market where buyers are willing to meet sellers’ terms more readily than in the past, likely due to the limited inventory.
Regarding pricing, the average sales price remained stable at $846,667, showing no change from the previous year when calculated using a rolling 6-month average. This stability in the average sales price, despite the tight inventory, suggests that pricing in the area has reached a plateau, with values holding steady over time.
The average price per square foot experienced a slight increase, rising by 2.9% to $288, based on a rolling 6-month average. This modest increase in price per square foot reflects a gradual appreciation in property values, potentially driven by the quality of available homes, their features, or improvements in the neighborhood’s desirability.
In summary, the residential real estate market adjacent to Riverboat Rd. (north and south) for January 2024 is characterized by a significant contraction in inventory, with a corresponding increase in market efficiency as evidenced by reduced average days on market and an improvement in the list to sold price percentage.
The stable sales volume and pricing suggest a market that, while tight, remains balanced in terms of demand and supply dynamics. Buyers in this market may face challenges due to the limited inventory, while sellers can benefit from a competitive selling environment, particularly if their properties are well-positioned and priced appropriately.
Area: Country Springs/ Cimmaron Ranch
(Western Edge of 91752 ZIP Code, Eastvale, CA)
The residential real estate market in the Country Springs-Cimmaron Ranch area for the month ending January 2024 exhibits a dynamic yet stable environment, characterized by consistent inventory levels, an influx of new listings, and brisk sales activity. This report delves into the key metrics that define the current market landscape, offering insights into the trends that are shaping the local real estate scene.
At the close of January 2024, the area reported an end-of-month active listing count of two properties, mirroring the inventory levels from the same period last year. This stability in the number of active listings indicates a market that has maintained a steady flow of properties available for sale, without significant fluctuations that could disrupt market balance.
The introduction of new listings saw a remarkable uptick, with two new properties entering the market, representing a 100% increase compared to the previous year. This surge in new listings is a positive development, suggesting that homeowners are increasingly motivated to sell, possibly driven by favorable market conditions or perceptions of peak market values.
The months supply of inventory, a critical indicator of market balance measuring the ratio of available homes to the sales rate, stood at 1.3 months. This represents an 18.2% increase from the previous year, indicating a slight easing of the market.
However, with a supply still under two months, the market remains firmly in seller’s territory, where demand outpaces the available inventory.
Sales activity remained steady, with one closed sale during the month, consistent with the previous year’s performance. This stability in sales volume, amidst an increase in new listings, underscores a sustained demand that keeps pace with the addition of new inventory to the market.
A significant decrease in the average days on market to just 13 days, down 40.9% from the previous year, highlights a market where properties sell rapidly. This decrease is indicative of a highly competitive environment, where well-priced and desirable properties quickly attract buyers, leading to swift sales.
The list to sold price percentage achieved a remarkable benchmark at 100%, indicating that on average, homes sold for their asking price. This efficiency underscores a market dynamic where buyers are willing to meet sellers’ price expectations, further emphasizing the competitive nature of the local real estate landscape.
In terms of pricing, the average sales price experienced a modest increase of 1.0% over the past year, reaching $862,472. This growth, calculated on a rolling 6-month average, reflects a steady appreciation in property values, suggesting a healthy market condition that supports gradual price increases.
Conversely, the average price per square foot witnessed a slight decline of 3.8% to $276, also calculated using a rolling 6-month average. This decrease might suggest a variation in the types of properties sold, possibly larger homes which generally have a lower price per square foot, or a shift in buyer preferences.
In summary, the Country Springs-Cimmaron Ranch residential area’s real estate market for January 2024 presents a picture of robust activity, with a notable increase in new listings and properties selling rapidly at full list price. While the average sales price shows modest growth, the slight dip in price per square foot warrants attention to underlying market shifts.
Overall, the market dynamics indicate a favorable environment for sellers due to the fast pace of sales and for buyers, a need for decisiveness in a competitive market.
Area: Stratford Township Homes
(Western Edge of Jurupa Valley 91752)
In the Stratford Township residential area, the real estate market update for January 2024 presents a nuanced picture of stability and change, marked by consistent inventory levels and significant shifts in pricing trends. This report provides a comprehensive analysis of the current market conditions, offering valuable insights for both potential buyers and sellers navigating the Stratford Township real estate landscape.
As the month closed, the inventory of active listings in Stratford Township stood at three properties, showing no change from the previous year. This consistency in inventory levels indicates a stable market, with neither significant increases in supply nor decreases that might indicate a tightening market. Such stability suggests that while there hasn’t been a surge in new listings, the market is maintaining a steady flow of properties available for sale.
The number of new listings introduced to the market in January also remained unchanged from the previous year, with just one new property being listed. This stability in new listings, coupled with the unchanged active listings count, suggests that the market dynamics in terms of inventory introduction have remained relatively constant over the past year.
The months supply of inventory, a critical measure that gauges the balance between supply and demand by estimating how many months it would take to sell through the current inventory at the present sales rate, experienced a slight decrease to 1.8 months. This 5.3% reduction from the previous year indicates a marginal tightening of the market, suggesting that demand may be slightly outpacing the supply of new listings, albeit not significantly so.
Notably, there were no closed sales reported in the month, marking a pause in transactional activity within the Stratford Township area. The absence of closed sales precludes the calculation of data such as average days on market and list to sold price percentage, metrics that typically offer insights into the pace of sales and negotiation dynamics between buyers and sellers.
Despite the lack of sales data, the average sales price in Stratford Township experienced a decrease of 6.9% from the previous year, settling at $794,600, based on a rolling 6-month average. This reduction in the average sales price could reflect a variety of factors, including changes in the types of properties sold, buyer preferences, or broader economic conditions influencing market valuations.
Conversely, the average price per square foot saw a significant increase of 23.9% to $295, also calculated using a rolling 6-month average. This substantial rise in price per square foot contrasts with the decrease in the overall average sales price, possibly indicating a shift towards the sale of smaller properties at higher price points or an overall increase in property values that is not uniformly reflected in the average sales price.
In summary, the Stratford Township residential real estate market for January 2024 depicts a landscape of steady inventory levels with an undercurrent of changing pricing dynamics. The stability in the number of active and new listings, combined with a slight tightening in the months supply of inventory, frames a market that is maintaining equilibrium.
However, the absence of closed sales in the month and the contrasting trends in average sales price and price per square foot signal underlying shifts that warrant close monitoring.
For potential sellers, the market presents an opportunity to capitalize on the rising price per square foot, while buyers should remain attentive to the evolving pricing trends and the stable supply landscape.
AREA: Eastvale Estates (Bellegrave Ave./Hamner Ave/)
(Western Edge of 91752 ZIP Code, Eastvale, CA)
The real estate market update for the Eastvale Estates residential area for January 2024 presents a unique situation, characterized by an absence of inventory and activity, which marks a significant departure from typical market dynamics.
This report aims to provide an overview of the current state of the market, using available metrics to draw insights and implications for potential buyers and sellers within this locale.
As the month concluded, Eastvale Estates reported no active listings, indicating a complete depletion of inventory and marking a dramatic 100% decrease from the previous year. This unprecedented absence of available properties for sale signifies a stagnant market condition, where no new properties have been listed, and no sales activity could be recorded.
The lack of new listings, maintaining a status quo from the previous year, further underscores the halted state of the market in terms of new supply.
Given the absence of active and new listings, the area effectively has no months supply of inventory. This unusual situation means there is no measurable stock of homes available for sale, which in a typical market, would indicate the time it would take to sell all current listings at the current pace of sales.
With no closed sales reported for the month, and consequently, the previous year, there is an absence of transactional data such as average days on market and list to sold price percentage. These metrics, which typically offer insights into the pace at which properties are selling and the negotiation dynamics between buyers and sellers, are not applicable in this scenario due to the lack of sales activity.
Despite the absence of current sales and listing data, the average sales price within Eastvale Estates, calculated using a rolling 6-month average, stands at $800,000. This figure, although static in the context of the current report, provides a benchmark for understanding property values within the area under recent market conditions.
Similarly, the average price per square foot has been calculated at $342 offering a measure of value that remains relevant for evaluating property worth in the area, based on past transactions.
In summary, the Eastvale Estates residential area is experiencing an extraordinary period of inactivity, with no properties listed or sold as of January 2024. This situation presents a challenging environment for both potential buyers, who have no options within this market, and sellers, who may be waiting for more favorable conditions to list their properties.
The reported average sales price and price per square foot, derived from past transactions, remain as indicators of the area’s property value landscape during more active periods.
Stakeholders in the Eastvale Estates real estate market may need to look beyond the immediate area for opportunities or await changes in market conditions that could reintroduce inventory and activity to this currently dormant market.
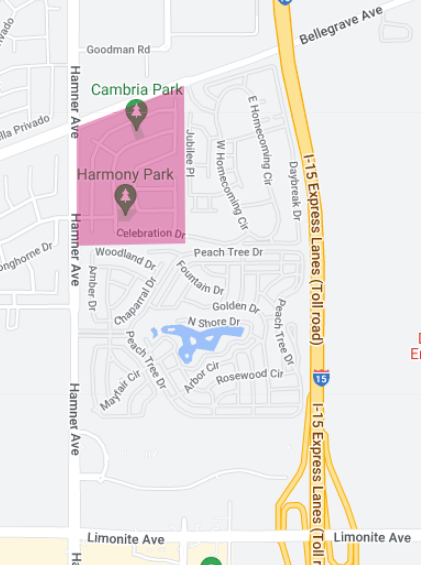
Area: Harvest Villages at Vernola Ranch
(Western Edge of Jurupa Valley 91752)
The Harvest Villages residential area real estate market report for January 2024 paints a picture of a market experiencing significant shifts in inventory levels and pricing dynamics, despite a stagnation in sales activity. This analysis aims to shed light on the current state of the market, providing valuable insights for potential buyers and sellers navigating the Harvest Villages real estate landscape.
As of the end of January 2024, there was only one active listing in Harvest Villages, marking a substantial decrease of 66.7% from the previous year. This dramatic reduction in active listings highlights a tightened market where potential buyers have markedly fewer options to consider, pointing towards a more competitive landscape for the available properties.
The number of new listings introduced to the market remained unchanged from the previous year, with no new properties being listed during the month. This lack of new inventory entering the market further contributes to the constrained supply, limiting the opportunities for buyers to find new options and potentially impacting the market dynamics by sustaining upward pressure on property values.
The months supply of inventory, which provides an estimate of how long it would take to sell through the current inventory given the current sales pace, stands at 0.8 months. This represents a significant decrease of 60.0% from the previous year, indicating a market moving at a brisk pace, albeit without the corresponding sales activity to demonstrate this velocity due to the lack of closed sales in the current period.
With no closed sales reported for January 2024, and consequently, no average days on market data available, it is challenging to gauge the transactional tempo that would typically illustrate the market’s liquidity and the efficiency of the sales process.
The list to sold price percentage, calculated using a rolling 3-month average, stands at 96.0%. This figure, while high, represents a decrease of 5.9% from the previous year, suggesting a slight shift in negotiation dynamics that could be indicative of buyers gaining a marginally stronger position in negotiations or reflecting specific conditions of the transactions that contributed to this average.
Despite the absence of sales activity in the current period, the average sales price in Harvest Villages has seen a notable increase of 7.7% from the previous year, reaching $900,714 when calculated using a rolling 6-month average. This appreciation in sales prices suggests that the area remains desirable, with property values continuing to rise, possibly driven by underlying factors such as location desirability, housing quality, and limited inventory.
Similarly, the average price per square foot has increased by 9.5% to $287, also calculated using a rolling 6-month average. This increase further underscores the area’s value appreciation, reflecting a market where square footage commands a premium, potentially due to the quality of living spaces or the appeal of the community’s amenities and environment.
In summary, the Harvest Villages residential area is experiencing a market characterized by significantly reduced inventory and the absence of sales activity in January 2024.
Despite these challenges, the continued appreciation in property values, as evidenced by the increases in the average sales price and price per square foot, highlights a market that retains its attractiveness to homeowners and investors. The tightening inventory suggests a competitive environment for buyers, while the pricing trends offer optimistic prospects for sellers considering listing their properties in the near future.
Area: Mira Loma Village,
(North-Western portion of Jurupa Valley 91752)
The real estate market report for the Mira Loma Village residential area for the month ending January 2024 reveals a market with an absence of activity in terms of listings and sales yet provides an interesting perspective on pricing trends based on historical data. This analysis aims to offer insights into the state of the market, drawing on the available metrics and recent sales history.
As the month concluded, Mira Loma Village reported no active listings, maintaining the same status as the previous year. Similarly, there were no new listings introduced to the market during the month, indicating a standstill in inventory turnover. This lack of inventory movement signifies a stagnant market condition for the period, with no properties available for sale or entering the market.
The absence of closed sales in January 2024 further underscores the current inactivity within the Mira Loma Village real estate market. Consequently, there is no data available for average days on market, which typically serves as a key indicator of market liquidity and the pace at which properties are being sold.
Despite the lack of current sales activity, the list to sold price percentage, calculated using a rolling 6-month average, stands at an impressive 105.6%. This figure indicates that, on average, properties have been selling for more than their listing price over the past six months, suggesting a market condition where buyers are willing to pay a premium above the asking price, likely due to competition for the limited inventory that was available during that period.
The average sales price in Mira Loma Village, calculated using a rolling 6-month average, is reported at $597,500. This pricing benchmark provides a reference for the valuation of properties within the area, reflecting the price point at which homes have been trading when available.
The average price per square foot has been calculated at $453, also using a rolling 6-month average. This metric offers insight into the value attributed to the living space within the area, showcasing a relatively high valuation that aligns with the premium list to sold price percentage.
An examination of specific sales since January 1, 2023, reveals that two houses were sold, one in February 2023 listed at $610,000 and sold for $615,000, and the second in August 2023, listed at $525,000 and sold for $580,000.
These transactions exemplify the competitive nature of the market during those periods, with both properties selling above their listing prices, further illustrating the demand dynamics and valuation trends within Mira Loma Village.
In summary, the Mira Loma Village residential area is experiencing a period of market inactivity with no new or active listings and no sales occurring in January 2024.
However, the historical sales data and the calculated averages for list to sold price percentage, sales price, and price per square foot indicate a market that, when active, is competitive and capable of commanding premium valuations.
For potential sellers, this data suggests that properties in Mira Loma Village may still attract significant interest and favorable pricing when the market resumes activity. For buyers, the historical premium over listing prices indicates a need for readiness to act decisively in a competitive market environment.
Area: Homestead,
(North-Western portion of Jurupa Valley 91752)
In the Homestead residential area, the real estate market update for January 2024 showcases a market with a unique set of circumstances, highlighted by an absence of inventory but a continued demonstration of demand through a closed sale. This report delves into the nuances of the current market conditions, providing insights based on the metrics available.
As of the end of January 2024, the Homestead area reported no active listings, indicating a complete depletion of inventory. This represents a significant shift from the previous year, with a 100% decrease in available properties.
The absence of new listings entering the market further underscores the stagnant state of inventory turnover, presenting a scenario where potential buyers have no new options within this specific market area.
Despite the absence of available inventory, the area recorded one closed sale during the month, mirroring the sales activity from the previous year. This sale indicates that, although new and active listings are nonexistent, there remains an undercurrent of demand capable of absorbing the sparse inventory that does become available.
The average days on market for the property sold remained at 5 days, consistent with the previous year’s data. This rapid pace of sale underscores a highly competitive market condition, where available properties are quickly moving from listing to sale, likely due to the scarcity of options and the readiness of buyers to act swiftly.
The list to sold price percentage for the sale achieved was 102.7%, also consistent with the previous year’s performance. This metric indicates that properties, on average, are selling for above their listing price, reflecting a market dynamic where buyers are willing to pay a premium to secure properties in the Homestead area.
The average sales price in the Homestead residential area saw an increase of 4.3% from the previous year, reaching $565,322, when calculated using a rolling 6-month average. This appreciation in sales price suggests a healthy valuation trend, where property values continue to grow, potentially driven by the area’s desirability and the overall market conditions favoring sellers.
Similarly, the average price per square foot experienced a growth of 3.3%, reaching $435, based on a rolling 6-month average. This increase further emphasizes the rising property values within the Homestead area, indicating a robust market where space is at a premium, and buyers are recognizing the value of homes in this locale.
In summary, the Homestead residential area’s real estate market for January 2024 is characterized by an unprecedented lack of inventory, yet demonstrates resilience through the recorded sale. The quick sale pace, above-list selling prices, and appreciation in average sales price and price per square foot all point to a competitive market environment.
For potential sellers, the current conditions suggest that if properties were to be listed, they could likely expect strong interest and favorable selling conditions. For buyers, the market demands readiness to act quickly and possibly above asking price to secure a home in this desirable area.
**********************
As a real estate broker, understanding the above nuanced market shifts is key to providing informed advice and strategy to sellers throughout the 91752-zip code area.
For a comprehensive understanding of how the trends above can impact your real estate decisions, contact me. I provide expert guidance and strategic insights and can guide you through these interesting times in real estate.
Manny Barba
Broker-Attorney-Realtor®
951-990-3998
MB Live Realty, Inc.
Note: All data in this report is from California Regional Multiple Listing Service (CRMLS) All information should be independently reviewed and verified for accuracy. This report is for informational purposes only and not intended as financial or investment advice.

No Comments