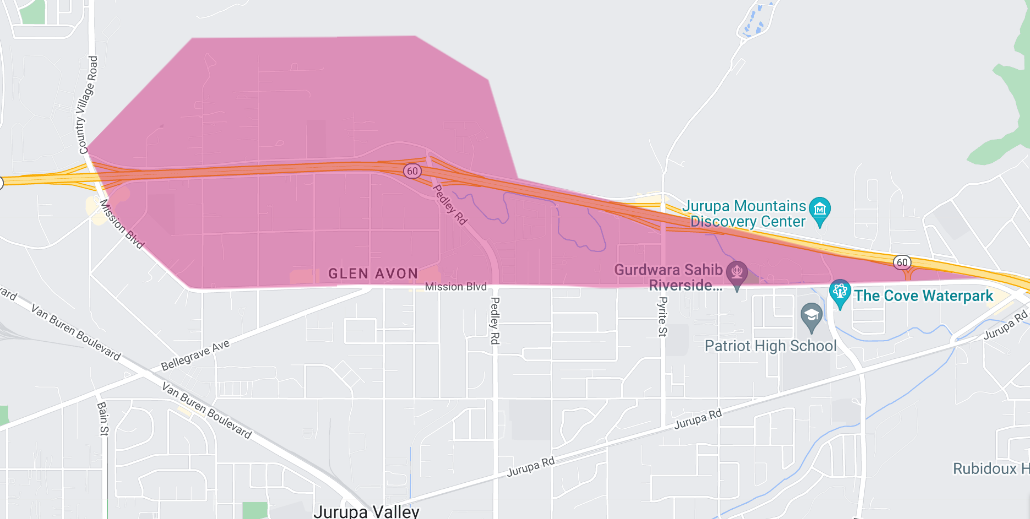
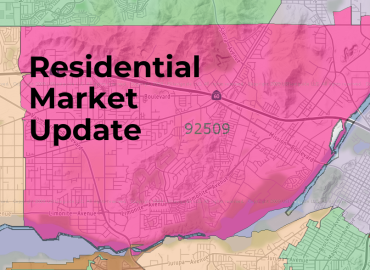
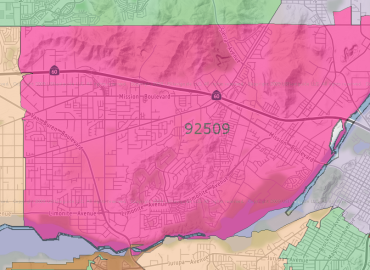
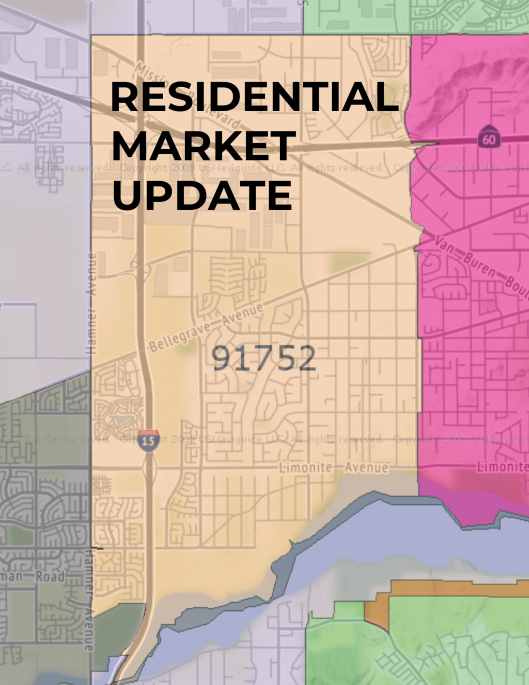
92509 Residential Real Estate Market Update – Jurupa Valley – February 2024
History of the 92509
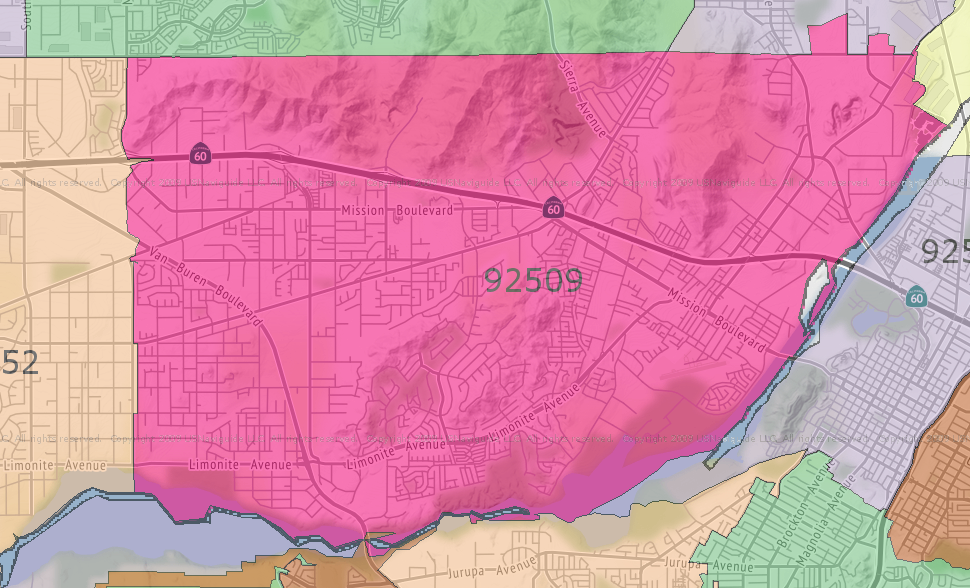
The 92509 ZIP code area, primarily associated with City of Jurupa Valley in Riverside County, California, has a rich history that intertwines with the broader development of Southern California.
Initially, the area was inhabited by the Gabrielino and Serrano Tribes. Later, in 1838, the Mexican government granted Rancho Jurupa to Juan Bandini, a prominent Californio entrepreneur, marking the beginning of non-Native settlement. The name “Jurupa” was used as early as 1887 and is derived from a previous rancho operated by the Mission San Gabriel Arcángel, which was disbanded in 1833. The exact meaning of “Jurupa” is debated, with some suggesting it means “watering place” or refers to a local plant, the Artemisia californica.
Efforts to incorporate the city began in 1992, with voters initially rejecting the proposal. However, on March 8, 2011, a successful vote led to the incorporation of Jurupa Valley, effective July 1, 2011. This new city included several communities like Mira Loma, Glen Avon, and Rubidoux. Jurupa Valley faced financial challenges early on, nearly leading to disincorporation, but these were eventually resolved with state legislative action.
As for demographics, the 2010 U.S. Census reported that Glen Avon, a part of the 92509 area, had a diverse population with a significant Hispanic/ Latino presence. The area has evolved over time, reflecting broader demographic and economic trends in Southern California.
Jurupa Valley’s governance includes a city council and a mayor, with representation at the state and federal levels aligning with California’s legislative districts. The area is served by the Jurupa Unified School District, providing educational services through various schools.
The history of the 92509 ZIP code area is a microcosm of the broader historical, cultural, and political developments of Southern California, marked by its early Native American presence, ranching origins, and evolving community identity in the modern era.
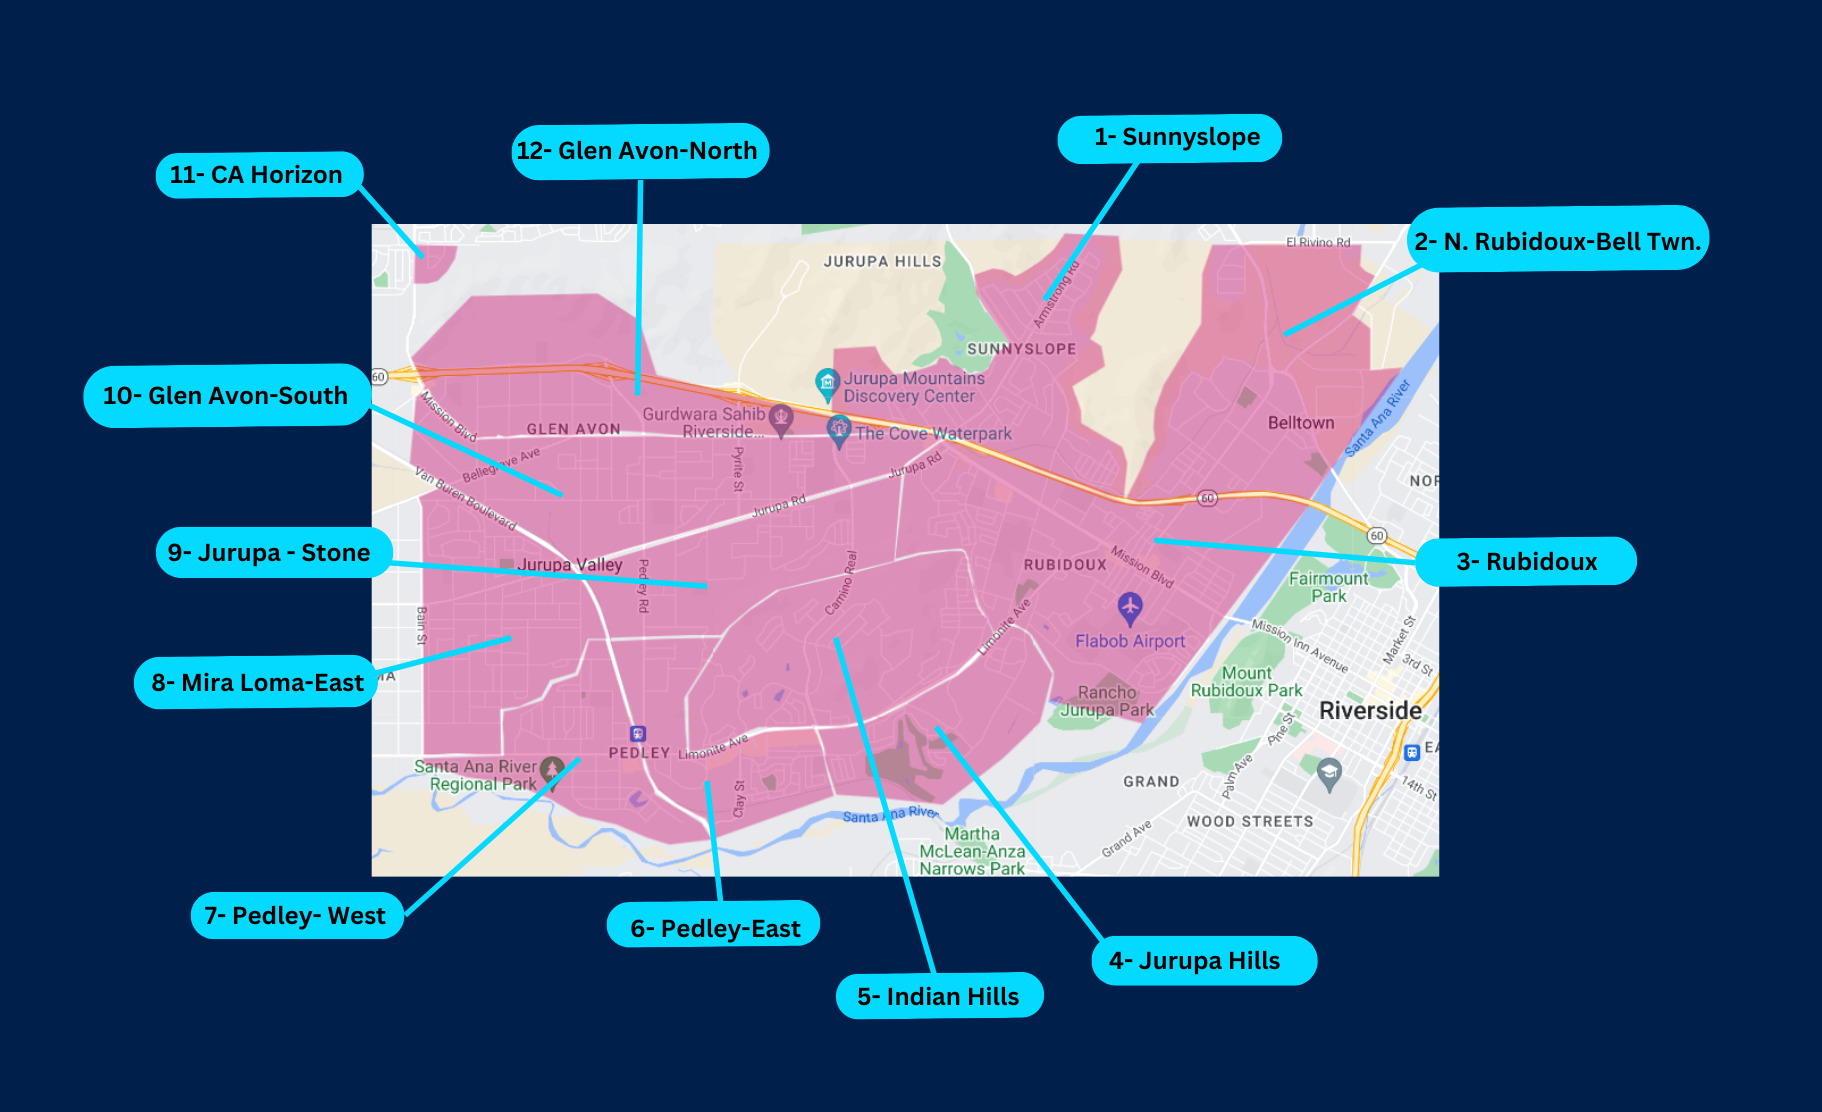
The data that follows is not intended to be a comparative market analysis for any one particular home, but instead gives a general valuation for homes in each of the 12 specified areas, and in whole the entire residential areas located in the 92509-zip code.
For a detailed and personalized market analysis of your home, or if you have any questions, feel free to contact me.
Manny Barba,
Broker-Attorney-Realtor®
DRE #00879806
951-990-3998
mail@mbliverealty.com
MB Live Realty, Inc.
AREA 1:
Sunnyslope,
Jurupa Valley, CA 92509
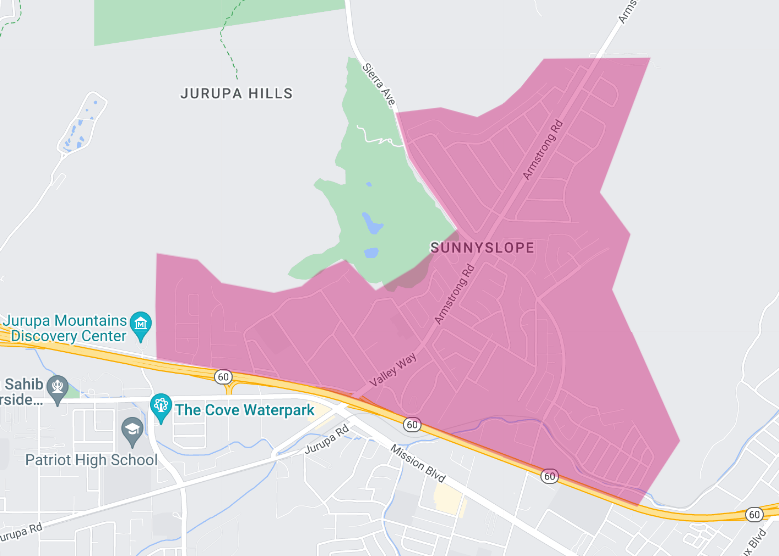
In our latest market update for the Sunnyslope residential area as of February 2024, we navigate through a landscape of significant changes and trends that are shaping the local real estate market. This report aims to provide a comprehensive overview, making clear the nuances for those interested in buying or selling in this community.
The Sunnyslope area has seen a marked decrease in the number of end-of-month active listings, which stood at four, representing a 50.0% reduction from the previous year. This significant drop in inventory levels suggests a tightening market, where fewer properties are available for sale, potentially heightening competition among buyers.
Despite this decrease in active listings, the number of new listings remained stable compared to the previous year, with two new properties entering the market. This stability in new listings indicates a consistent rate of homeowners looking to sell, despite the overall reduction in active inventory.
The months’ supply of inventory, a critical metric indicating the balance between supply and demand, has decreased by 20.0% from the previous year to 1.2 months. This reduction underscores a quicker pace of sales relative to the inventory, moving the market closer to conditions that generally favor sellers.
Sales activity in the Sunnyslope area has decreased, with closed sales halving from the year before to just one sale. This reduction in sales volume may reflect the limited availability of properties and/or shifts in buyer demand.
One of the most dramatic changes observed is the average days on market, which plummeted by 80.4% to just 11 days. This steep decline indicates that properties are selling much faster than in the previous year, illustrating a market where demand outpaces supply, leading to quicker sales.
The list to sold price percentage has experienced a slight decrease, moving to 95.8%, a 1.2% drop from the previous year. This slight adjustment indicates that, on average, properties are selling slightly below their listing price, which might suggest a bit of negotiation room for buyers, despite the overall tightness in the market.
Financially, the Sunnyslope area has seen substantial growth in property values. The average sales price has increased by 12.4% from the previous year to $713,723, as calculated using a rolling 3-month average. This increase in sales price reflects a robust appreciation in property values, likely driven by the area’s desirability and the tight inventory conditions.
Similarly, the average price per square foot has risen by 14.8% to $372, again using a rolling 3-month average calculation. This increase further confirms the upward trajectory in property values, indicating that not only are homes selling for more overall, but the value of the living space within these homes is also rising.
In conclusion, the Sunnyslope residential area presents a dynamic and rapidly evolving market as of February 2024. The substantial decrease in active listings combined with stable new listings has created a competitive environment, further evidenced by the drastic reduction in average days on market. Meanwhile, the increase in both the average sales price and price per square foot highlights significant property value appreciation, underscoring the area’s attractiveness to both buyers and sellers.
For stakeholders in the Sunnyslope real estate market, these trends underscore the importance of strategic planning and swift action in a market characterized by rapid sales and rising values.
Area 2:
North Rubidoux-Belltown
Jurupa Valley, CA 92509
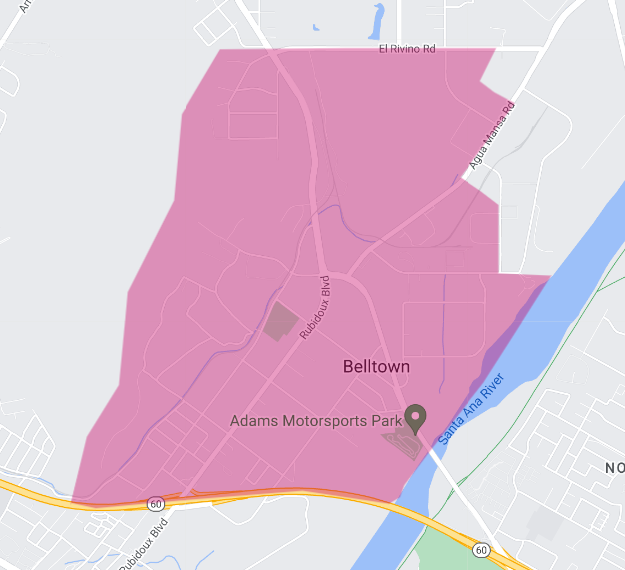
For the month ending February 2024, the north Rubidoux-Belltown residential area has experienced a mixture of growth and stagnation, reflecting a complex real estate market environment. This report aims to dissect these trends, providing a clear picture for both prospective buyers and sellers in the area.
The end of month active listings saw a notable increase, rising to four properties, which marks a 33.3% change from the previous year. This growth in active listings indicates a slight easing in the market’s inventory, potentially offering more options for buyers navigating the area.
Simultaneously, new listings have doubled from the previous year, with two new properties introduced to the market. This significant 100.0% increase in new listings suggests a growing willingness among homeowners to sell, possibly motivated by the prevailing market conditions or expectations of favorable outcomes.
The months’ supply of inventory has seen a substantial increase, rising to 3.3 months, which is a 65.0% change from the previous year. This increase in the months’ supply of inventory indicates a market moving towards a more balanced state, where the supply of homes is more closely aligned with demand, though still leaning towards a seller’s market given the traditional benchmark of a 5-6 months supply indicating balance.
Despite these increases in listings and inventory, the area recorded no closed sales for the month, marking a significant -100.0% change from the previous year. The absence of closed sales provides no data for average days on market and list to sold price percentage, leaving a gap in understanding the current pace of transactions and negotiation dynamics within the market.
Financially, the north Rubidoux-Belltown area has seen remarkable growth in property values. The average sales price has surged to $555,000, reflecting a 65.7% increase from the previous year, as calculated using a rolling 3-month average. Similarly, the average price per square foot has risen sharply by 65.6% to $467, according to the same calculation method. These substantial increases in both the average sales price and price per square foot highlight a significant appreciation in property values, likely driven by factors such as increased demand, perceived value in the area, or improvements in property quality.
In summary, the north Rubidoux-Belltown residential area is navigating through a period of considerable change as of February 2024. The increase in both active and new listings suggests a market that is becoming more active, with more opportunities for buyers. However, the lack of closed sales signals a possible mismatch between buyer expectations and market offerings or other inhibiting factors affecting sales completion.
The significant appreciation in property values underscores the area’s potential attractiveness to sellers, given the robust gains in both sales price and price per square foot. For participants in the north Rubidoux-Belltown real estate market, these trends emphasize the importance of understanding current market dynamics and aligning strategies accordingly, whether looking to buy or sell in this evolving landscape.
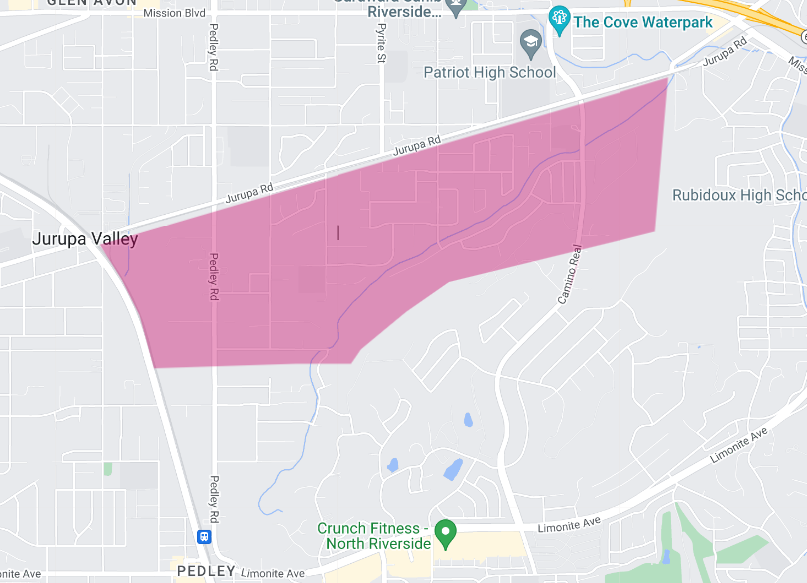
Area 3:
Rubidoux,
Jurupa Valley, CA 92509
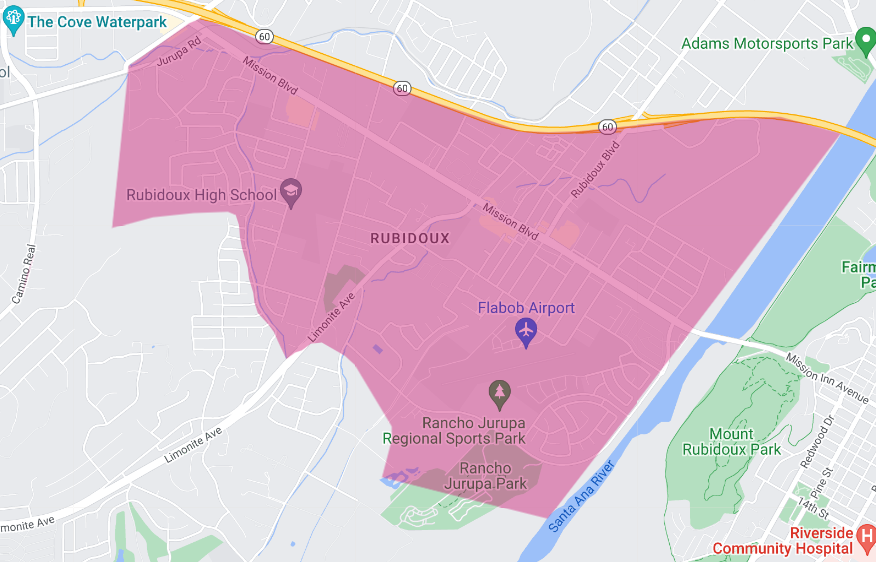
As we analyze the real estate market for the Rubidoux area for the month ending February 2024, we observe a landscape characterized by nuanced shifts in both inventory levels and market activity. This report aims to distill the key trends and metrics, providing a balanced overview for those considering buying or selling in Rubidoux.
Starting with the inventory, the end of month active listings totaled 11, marking a modest decrease of 8.3% from the previous year. This slight reduction in available properties indicates a slight tightening in the market inventory, potentially leading to increased competition among buyers for the available homes.
Despite this decrease in active listings, the number of new listings entering the market remained steady, with four properties listed, unchanged from the previous year. This stability in new listings suggests a consistent flow of properties coming onto the market, offering opportunities for buyers despite the overall decrease in active listings.
The months’ supply of inventory, an important indicator of market balance, stood at 2.1 months. This figure represents a 23.5% increase from the previous year, indicating a slight shift towards a more balanced market, though still favoring sellers with the supply remaining relatively low.
Sales activity in the Rubidoux area has seen a significant downturn, with closed sales dropping by 57.1% to just three transactions. This decrease in sales volume could reflect various factors, including potential mismatches between buyer expectations and the properties available or broader economic conditions impacting buyer activity.
One of the brighter spots in the market is the average days on market, which decreased by 14.6% to 35 days. This reduction suggests that, despite fewer sales, properties that do sell are moving at a quicker pace than the previous year, indicating continued demand for homes in Rubidoux.
Financially, the market has shown positive signs of growth. The list to sold price percentage slightly increased to 99.2%, up 0.8% from the previous year, suggesting that homes are selling very close to their asking prices, a sign of a competitive market environment.
The average sales price experienced a healthy increase of 9.0% from the previous year, reaching $566,667. This growth in sales price points to a rising valuation of properties in the area, likely driven by sustained demand and the overall attractiveness of the Rubidoux market.
Similarly, the average price per square foot saw a significant increase of 23.8% to $448. This substantial rise further underscores the value being placed on properties in Rubidoux, indicating strong market conditions and potentially signaling increased buyer willingness to invest in higher-valued homes.
In summary, the Rubidoux residential real estate market in February 2024 presents a complex picture of slight inventory tightening, stable new listings, reduced sales volume, and quicker sales for those transactions that do occur.
The financial metrics, including the average sales price and price per square foot, reflect a market that is appreciating in value, offering potential opportunities for sellers to capitalize on increased property valuations. For buyers, the competitive environment underscored by high list-to-sold price percentages suggests the importance of decisive action and strategic offers.
As the market continues to evolve, staying informed on these trends will be crucial for those looking to navigate the Rubidoux real estate landscape effectively.
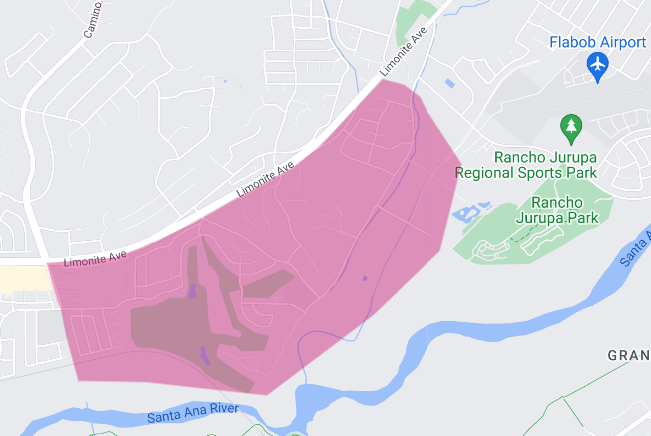
Area 4:
Jurupa Hills,
Jurupa Valley 92509
For the month ending February 2024, the real estate market in the Jurupa Hills area presents a mixed landscape of stability and significant shifts in certain metrics. This report aims to provide a comprehensive analysis of the current market trends, offering valuable insights to both potential buyers and sellers.
The end of month active listings in Jurupa Hills remained stable at three properties, mirroring the count from a year ago. This consistency in inventory levels suggests a steady state of property availability in the area, without any significant increase or decrease in the number of homes for sale.
However, the market experienced a notable decrease in the number of new listings, with just one new property coming onto the market, marking a 50.0% reduction from the previous year. This decline in new listings could signal a cautious approach from potential sellers or possibly reflect a tight market where homeowners are reluctant to sell.
The months’ supply of inventory has seen a substantial increase, rising to 1.6 months. This 45.5% increase from the previous year indicates a slight shift towards a more balanced market, though it still leans towards being seller-friendly due to the relatively low supply.
A significant point of concern is the lack of closed sales this month, a stark contrast to the previous year and marking a 100.0% decrease. The absence of sales activity prevents the calculation of average days on market and list to sold price percentage, leaving a gap in understanding the market’s transactional dynamics.
Financially, the Jurupa Hills area has witnessed positive growth. The average sales price saw a 10.6% increase from the previous year, reaching $659,938, as calculated using a rolling 6-month average. This increase in sales price suggests a robust appreciation in property values, likely driven by sustained demand and the quality of homes available in the area.
Similarly, the average price per square foot rose by 11.0% to $374, according to the same rolling 6-month average calculation. This increase further underscores the rising value of real estate in Jurupa Hills, indicating that buyers are willing to invest more per square foot than they were a year ago.
In summary, the Jurupa Hills residential real estate market for February 2024 shows a market with stable inventory levels but reduced new listings, indicating a potential bottleneck for buyers looking for new opportunities. The significant increase in months’ supply inventory alongside the lack of closed sales highlights a market facing challenges in converting listings into sales.
Despite these transactional challenges, the substantial increases in both the average sales price and price per square foot reflect a market where property values continue to rise, offering promising opportunities for sellers. For buyers, the current market dynamics emphasize the need for readiness and flexibility, as the competition for available homes may intensify given the limited inventory and rising property values.
Area 5:
Indian Hills
Jurupa Valley, CA 92509

As we examine the residential real estate market for the Indian Hills area as of the close of February 2024, several key trends have emerged that are worth noting. This report reviews the month’s activity and provides an analysis of its implications for the local market.
The inventory of active listings at the end of the month has undergone a significant decrease, with only five properties available, marking a 68.8% drop from the same time last year. This substantial decline in active listings is indicative of a tightening market, which may lead to increased competition among buyers due to the limited number of homes for sale.
In terms of new inventory entering the market, there has been a noteworthy reduction as well. With only three new listings, this represents a 57.1% decrease compared to the previous year, which further emphasizes the contracting supply of available properties.
The months’ supply inventory, which provides insight into the balance between supply and demand, now stands at 1.3 months. This is a 48.0% decrease from the previous year, signifying a faster absorption rate of available properties, illustrating a seller’s market.
Sales activity in the Indian Hills area has also seen a downturn, with closed sales declining by 66.7% to a single sale. This significant reduction in closed sales may reflect various market conditions, including possible shifts in buyer sentiment or changes in the economic landscape that affect purchasing decisions.
The average days on market for properties has decreased by 48.4% to 33 days. This reduction indicates that properties that do sell are doing so more quickly than in the previous year, which could be attributed to competitive buyer behavior in a market with scarce inventory.
One of the standout metrics for February is the list to sold price percentage, which has increased to 101.7%, up 5.9% from the previous year. This suggests that properties are, on average, selling for more than the asking price, indicating a market where bidding wars and competitive offers may be more common.
Financially, the market has seen some growth in property values. The average sales price has risen to $605,500, marking a 3.4% increase from the previous year, as determined by a rolling 3-month average. This gentle appreciation in sales prices suggests steady demand and a positive sentiment regarding property values in the Indian Hills area.
Additionally, the average price per square foot has increased to $388, a 7.5% increase based on a rolling 3-month average. This increase further indicates that the value of the residential properties in the area is on an upward trajectory, reinforcing the desirability of the Indian Hills community.
In conclusion, the Indian Hills residential real estate market in February 2024 is characterized by a significant decrease in both active and new listings, coupled with a rapid pace of sales for the few properties that have sold, as evidenced by the decrease in days on market and the increase in the list to sold price ratio. While closed sales have decreased, the increases in average sales price and price per square foot reflect a market that continues to appreciate in value.
For potential buyers, the current conditions suggest the need for decisiveness in a competitive market. For sellers, the market appears to remain favorable, with the potential to achieve sales at, or above, the listing price.
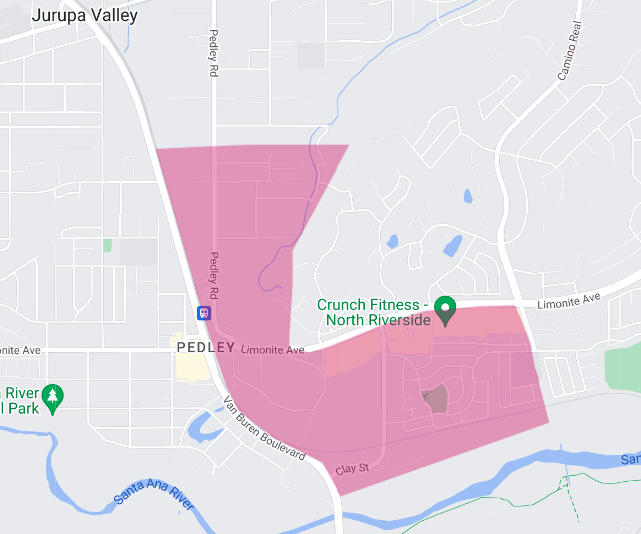
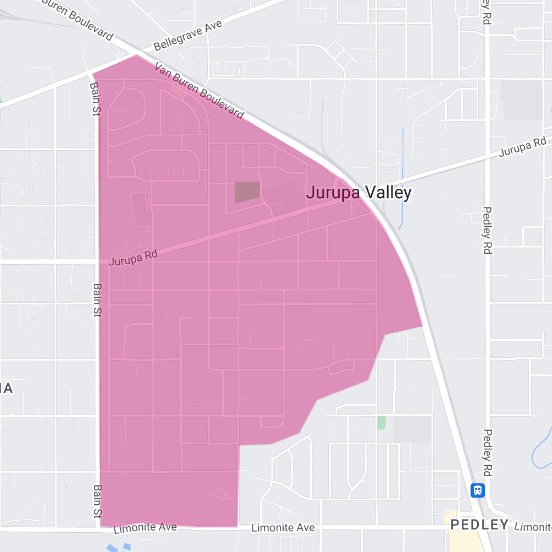
Area 6:
Pedley – East
Jurupa Valley, CA 92509
As we analyze the residential real estate market for the east Pedley area for February 2024, a number of intriguing trends emerge that are worth noting for anyone looking to buy or sell in this market.
The inventory of active listings at the end of February stood at four, a 33.3% decrease from the previous year. This reduction in active listings indicates a tightening of the market, with fewer homes available to potential buyers than there were a year ago.
While we lack comparative data for new listings from the previous year, we can report that there were five new listings in February. This influx of new listings, in the context of overall reduced active listings, suggests that while there is some movement in the market, overall inventory remains lower than it might have been in the past.
The months’ supply of inventory is a crucial indicator of the balance between supply and demand, and in east Pedley, this figure has fallen to 1.5 months. This represents a 28.6% decrease from last year, further underscoring a market where available homes are being absorbed more quickly than they were a year ago, though this is still a relatively short supply period.
Notably, there were no closed sales in February, a significant departure from last year’s activity and indicating a stall in transactions. The lack of closed sales provides us with no data for the average days on market or the list to sold price percentage, leaving a gap in the analytics that typically help us gauge the market’s temperature and transactional efficiency.
However, the financial metrics we do have tell an interesting story. The average sales price in east Pedley, based on a rolling 3-month average, stands at $754,320. This is a significant increase of 19.8% from the previous year, suggesting that the homes in the area are appreciating in value quite notably.
Further emphasizing this point is the average price per square foot, which has seen an extraordinary increase of 51.1% from the previous year to $500, as calculated on a rolling 3-month average. This suggests that not only are homes selling for more overall, but the value of the space within these homes is also increasing sharply.
In conclusion, the east Pedley residential area is experiencing a market with decreasing supply and high value appreciation. The substantial increases in average sales prices and price per square foot indicate a strong seller’s market, though the actual sales activity has slowed down.
For potential sellers, the market conditions seem favorable for listing their properties, as the high valuation suggests that they could realize significant returns. On the other hand, buyers may face a competitive market with limited inventory and will need to act decisively when opportunities arise.
As the market progresses, it will be important for both buyers and sellers to stay informed and react promptly to market changes.
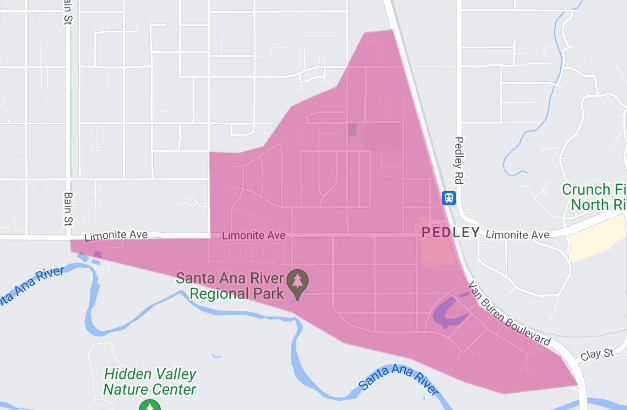
Area 7:
Pedley – West
Jurupa Valley 92509
Reflecting on the residential real estate market for the western Pedley area as of February 2024, we see a market that has experienced a series of significant shifts over the past year. This report will provide an analysis of these changes and offer insights into what they may mean for buyers and sellers in the area.
The number of active listings at the end of February decreased by half from the previous year, totaling only three. This 50.0% reduction in inventory indicates a considerable tightening in the market, likely leading to a competitive environment for buyers looking for homes in this area.
Contrasting with the decrease in active listings, new listings have shown a remarkable increase, doubling from the previous year to two. This surge suggests that while the overall inventory is lower, there is a renewed interest or confidence among sellers to enter the market.
The months’ supply of inventory, which provides insight into how many months it would take to sell the current inventory at the current sales rate, stands at just 0.8 months. This represents a significant 55.6% decrease from the previous year, indicating a market that is moving quickly and is strongly skewed towards sellers, with fewer options available for buyers.
Closed sales have seen a decrease of 33.3% compared to the previous year, with four homes sold. Despite the lower number of sales, it’s worth noting that the drop is not as steep as the reduction in active listings, suggesting that while fewer homes are available, there is still a consistent demand for properties in the area.
The average days on market has increased to 123 days, a substantial 55.7% rise from the previous year. This increase indicates that properties are taking much longer to sell, which may suggest some dissonance between sellers’ expectations and market realities or could reflect a more discerning buyer market.
In terms of pricing, the list to sold price percentage has seen a slight increase to 95.2%, up by 0.7% from the previous year. This indicates that homes are selling close to their asking price, albeit with some room for negotiation.
Financially, the western Pedley area has observed a 10.2% increase in the average sales price from the previous year, with the average now standing at $751,000. This appreciation in sales price indicates a healthy market with strong property values, despite the reduction in sales volume.
However, the average price per square foot has seen a marginal decrease of 0.6%, bringing it to $327. This slight decline might reflect changes in the types of properties being sold or perhaps a shift towards larger homes where the price per square foot is typically lower.
In summary, the western Pedley residential real estate market as of February 2024 is characterized by a significant contraction in inventory, an increase in new listings, a speedy absorption rate of inventory, a decline in closed sales, and properties taking longer to sell.
Despite these mixed signals, the overall financial health of the market seems robust, with an increase in average sales price even as the price per square foot experiences a slight decline.
For potential sellers, the market conditions appear to favor listing, given the combination of rising prices and low inventory. Buyers, on the other hand, may need to navigate the market strategically, given the competitive landscape and longer sales times.
Keeping a close eye on market trends will be key for those looking to make informed real estate decisions in the western Pedley area.
Area 8:
Mira Loma-East
Jurupa Valley 92509
As we examine the residential real estate market for the east Mira Loma area for the month ending February 2024, we observe a market with significant changes in inventory and sales activity compared to the previous year.
The number of end-of-month active listings in east Mira Loma has seen a dramatic decrease, with only one active listing left, marking an 83.3% decline from the year before. This steep drop in inventory indicates an exceptionally tight market, potentially creating a challenging environment for buyers who have very few options to choose from.
In stark contrast to the shrinking number of active listings, new listings have seen a remarkable increase, doubling from the previous year with four new properties on the market. This influx suggests a resurgence of seller activity, with more homeowners deciding to list their properties now compared to last year.
The months’ supply of inventory—which measures how many months it would take to sell through the current inventory at the present rate of sales—has fallen to just 0.5 months. This is a substantial decrease of 80.8% from the previous year, signaling a market that is moving at a brisk pace, heavily favoring sellers due to the scarcity of available homes.
A critical point to note is that there were no closed sales in February, a significant change from last year’s activity. The lack of closed sales prevents the reporting of data on average days on market and list to sold price percentage, key indicators that help gauge the market’s health and transactional pace.
Financially, the market has experienced a downturn in the average sales price, which has decreased by 4.3% from the previous year to $585,259, as per a rolling 3-month average. Similarly, the average price per square foot has also decreased by 4.2% to $411 over the same period. These reductions indicate a slight softening in property values, which may be due to a variety of factors, including changes in the types of homes sold or broader economic influences.
In summary, the east Mira Loma residential real estate market as of February 2024 is characterized by a significant decrease in active listings, a notable increase in new listings, and a sharp drop in months’ supply of inventory, alongside a decrease in closed sales.
The reductions in average sales price and price per square foot suggest a market where property values have adjusted downward slightly. For sellers, the low inventory and high number of new listings may indicate a market receptive to new offerings, albeit with potentially adjusted pricing expectations. For buyers, the limited inventory and recent pricing trends point to the need for prompt and decisive action when suitable properties do come onto the market.
It will be important for both buyers and sellers to stay informed on market conditions and work closely with real estate professionals to navigate the current landscape effectively.
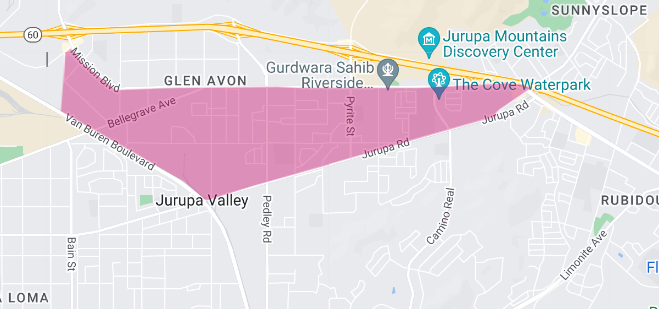
Area 9:
Jurupa – Stone
Jurupa Valley 92509
In this report, we’ll explore the current state of the residential real estate market in the Jurupa-Stone area for the month ending February 2024, examining various metrics and their implications for the market.
The Jurupa-Stone residential area saw a decrease in end-of-month active listings to just three properties, a 40.0% decline from the same time last year. This substantial drop in active listings indicates a tighter market with fewer options for prospective buyers, which could potentially lead to a competitive environment for those in search of a new home.
A notable point of concern is the absence of new listings this month, which reflects a 100.0% decrease from the previous year. This lack of new inventory entering the market could exacerbate the already low number of active listings, suggesting that homeowners may be hesitant to sell or could be waiting for more favorable conditions.
The months’ supply of inventory has seen a slight increase, up 11.1% from last year, to a total of 2.0 months. While this is an increase, it still indicates a market where inventory is moving relatively quickly, and supply remains lower than the demand, which is typically represented by a balanced market at about a 5-6 months’ supply.
Notably, there were no closed sales in the Jurupa-Stone area this month, marking a 100.0% decrease from last year. This lack of sales activity leaves us without data for average days on market and list to sold price percentage, which are critical indicators for understanding the pace of the market and the negotiation dynamics between buyers and sellers.
Despite the absence of sales data, we observe financial growth in the market. The average sales price, as per a rolling 6-month average, is $787,500, which is an 11.9% increase from the previous year. This indicates a rise in property values and suggests that homes in the area are becoming more valuable, which could be attributed to various factors such as desirability of location, improvements in property quality, or general market appreciation.
The average price per square foot has also seen a slight increase, growing by just 0.3% to $327, as calculated using a rolling 6-month average. This minimal growth suggests that while property values are increasing, the price per square foot is stabilizing, possibly indicating a shift towards larger homes being sold or a balance being reached between size and value.
In summary, the Jurupa-Stone residential market is experiencing a period of low active listings and no new listings, which has not translated into sales this past month. However, the increase in the average sales price and the stabilization of the price per square foot reflect a market with potential for sellers due to the appreciation of home values.
For buyers, the market demands decisiveness and perhaps patience, as the current conditions indicate that there may be competition for the few available properties. The lack of sales activity could suggest a temporary lull or a forthcoming adjustment in the market dynamics, making it crucial for stakeholders to stay informed and agile in their real estate strategies.
Area 10:
Glen Avon – South
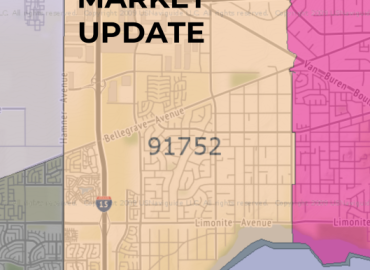
Jurupa Valley 91752
The residential real estate market in the south Glen Avon area has undergone substantial changes as of February 2024, presenting a distinctive picture of the local market trends.
At the end of February, there was only one active listing available in the area, which represents a dramatic 90.0% decrease from the same period last year. Such a significant drop in active listings has created an exceedingly limited inventory for potential buyers and can contribute to a competitive market environment where demand may exceed the available supply.
Contrasting the sharp decline in active listings, the number of new listings introduced to the market in February doubled from last year, with two new properties available. This 100.0% increase in new listings may indicate growing confidence among sellers or a response to the favorable market conditions, such as rising property values.
The months’ supply of inventory, which provides insight into how long the current stock of properties would last at the current sales rate, has fallen to just 0.2 months. This is an extreme 90.9% decrease from the previous year, indicating a market that is moving at an accelerated pace, with inventory turning over quickly and creating a dynamic that is highly favorable to sellers.
There was one closed sale reported in February, a decrease of 50.0% from the year prior. While sales volume has fallen, the fact that there is any sales activity in such a tight market is noteworthy and suggests that there is still active demand for homes in south Glen Avon.
Properties are taking slightly longer to sell than they did a year ago, with the average days on market rising to 74, an increase of 15.6%. This extended period on the market could indicate that while demand is present, buyers are taking more time to make decisions, or it could suggest some discrepancy between listing prices and buyer expectations.
The list to sold price percentage has seen an appreciable increase, rising to 97.8%, which is a 4.5% change from the previous year. This shows that homes are selling very close to their asking prices, a sign that the market remains competitive, with buyers willing to pay near-list prices for desirable homes.
In terms of home values, the average sales price has seen a significant increase, rising to $669,500. This represents a 15.1% increase over the previous year, based on a rolling 3-month average. This robust growth in average sales price indicates a healthy appreciation in property values, likely due to a combination of market demand and the intrinsic appeal of the area.
However, the average price per square foot has experienced a nominal decrease, dipping slightly by 0.2% to $415. This minor change suggests that while overall home values are up, the price per square foot is maintaining stability, which could be a result of a changing mix in the size and types of homes sold or slight market corrections.
In conclusion, the south Glen Avon residential real estate market as of February 2024 is characterized by a significantly reduced inventory and a notable increase in property values. The market conditions appear to be highly favorable for sellers, with properties commanding near-list prices and appreciating in value. Buyers, while facing a competitive market with very limited inventory, are still engaging, as indicated by the closed sale and the new listings.
For those looking to enter the market, whether buying or selling, the current trends underscore the importance of strategic pricing and understanding the local market dynamics. It will be essential for stakeholders to stay informed and make well-informed decisions in this rapidly evolving market.
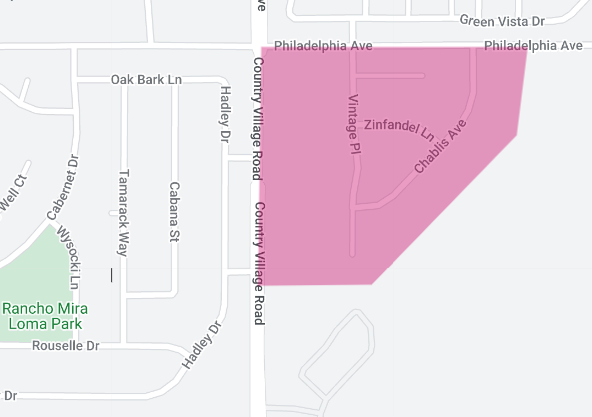
Area 11:
California Horizon,
Jurupa Valley 91752
As we review the residential real estate market for the California Horizon area for February 2024, we find ourselves in a unique position where traditional market indicators are not available due to a lack of inventory and sales activity.
The end of month active listings for the area stands at zero, showing no change from the previous year. Similarly, there were no new listings this month, which also mirrors the activity from last year. The absence of both active and new listings suggests a dormant market in terms of new activity, with no immediate options for potential buyers and no new opportunities for sellers entering the market.
Given the lack of active and new listings, we are unable to report on the months’ supply of inventory. This metric typically helps gauge the balance between supply and demand by estimating how long the current inventory of properties would last at the current rate of sales if no new listings were added. However, without any inventory, this measure is not applicable for the current period.
There were also no closed sales this month, and therefore no change from the previous year in this regard. The absence of closed sales activity means we do not have data for average days on market or list to sold price percentage, which are valuable indicators of market health and efficiency.
Due to the lack of recent sales, we also have insufficient data to determine the current average sale price for the area. The last recorded sale in the California Horizon area occurred in December 2022 when a 1600 square foot, 3 bedroom, 3 bathroom property, originally listed for $589,000 on October 7, 2022, closed on December 5, 2022, for $549,800. This sale price equates to a price per square foot of $343.62.
While the current report for the California Horizon area lacks the usual data points due to no recent market activity, the information from the last known sale can provide some insights. The sale from December 2022 reflects a market where properties were selling for less than the listing price, indicating that buyers had some leverage in negotiations at that time. It also gives a baseline for the price per square foot that may still be relevant for comparative purposes, should the market reactivate in the near future.
In conclusion, the California Horizon residential area is experiencing a period of inactivity with no listings or sales reported for February 2024. For those interested in this market, it will be essential to monitor the area closely for any new developments and to be ready to act quickly should the market pick up again.
For potential sellers, understanding the most recent sale data may help in setting expectations for pricing should they consider listing in the future. For buyers, staying abreast of changes will be key to finding opportunities in this currently quiet market.
Area 12:
Glen Avon,
Jurupa Valley 92509
As we reflect on the real estate market for the Glen Avon area for the month ending February 2024, we observe a market that presents both growth and stagnation in different aspects.
The end-of-month active listings stood at four, reflecting a significant increase of 33.3% from a year ago. This rise in active listings indicates that more homeowners are putting their properties on the market, providing potential buyers with a greater selection of homes than was available last year.
Despite the increase in active listings, there was no change in the number of new listings compared to the previous year, with just one new listing reported. The stability in new listings suggests a consistent rate at which properties are being offered to the market, which is a positive sign for ongoing market activity.
The months’ supply of inventory has grown to 2.8 months, up by 27.3% from the previous year. This increase in the months’ supply indicates that while there are more listings, they are not being absorbed as quickly as they might have been, which could hint at a slight shift towards a market that is more balanced between buyers and sellers.
A notable point of concern is the absence of closed sales this month, which is a stark decrease of 100.0% from the year prior. The lack of closed sales means that we have no data for average days on market or list to sold price percentage, leaving us without insight into how quickly homes are selling and how final sale prices compare to listing prices.
Financially, the market has experienced significant growth in property values. The average sales price in Glen Avon has surged to $645,000, marking an impressive 39.7% increase from the previous year, based on a rolling 3-month average. This suggests that while homes may be taking longer to sell, those that do are selling at much higher prices.
The average price per square foot also saw a substantial increase, climbing by 71.9% to $593, according to a rolling 3-month average. This dramatic rise in price per square foot is indicative of a significant increase in property value within the area, and possibly a preference for higher-quality homes.
In summary, the Glen Avon residential market as of February 2024 is characterized by an increase in active listings, stable new listings, a longer inventory supply, and a significant increase in property values despite a lack of recent sales. This could potentially create a favorable environment for sellers due to the higher property values, but they may need to be patient as the market absorbs the increased inventory.
Buyers may benefit from having more options to choose from but should be prepared for potentially higher prices. As we look ahead, those interested in the Glen Avon real estate market should monitor these trends closely, as they will play a crucial role in shaping the market dynamics in the coming months.
*************
As a real estate broker, understanding the nuanced market shifts in the above residential area market update reports is key to providing informed advice and strategy to sellers throughout the 92509 – zip code area.
For a comprehensive understanding of how the trends above can impact your real estate decisions, contact me. I provide expert guidance and strategic insights and can guide you through these interesting times in real estate.
Manny Barba
Broker-Attorney-Realtor®
951-990-3998
MB Live Realty, Inc.
Note: All data in this report is from California Regional Multiple Listing Service (CRMLS) All information should be independently reviewed and verified for accuracy. This report is for informational purposes only and not intended as financial or investment advice.
No Comments